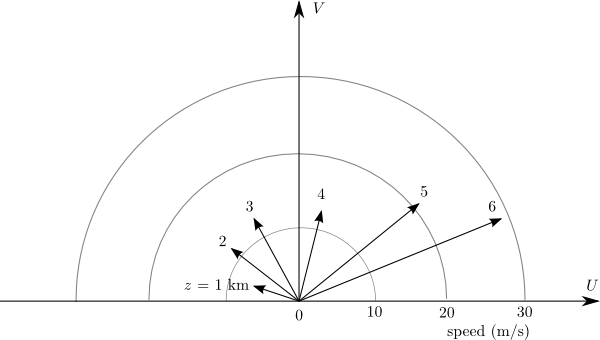
Figure 1. Plot of the wind vectors at elevations of 1,2, ..., 5, and 6 km.
|
Figure 1. Plot of the wind vectors at elevations of 1,2, ..., 5, and 6 km. |
A hodograph of wind data collected at a balloon launch site is made by first plotting the wind vectors at the elevations of 1,2,3,4,5, and 6 kilometers, as shown in Figure 1. The wind at the 1 km height is from the east-southeast at about 5 m/sec. The wind at the 2 km elevation is from the southeast at a speed of approximately 11 m/sec. The wind at the 6 km elevation is southwesterly at a speed of approximately 28 m/sec. The vertical wind shear pattern depicted on this chart is typical for the midwest during "thunderstorm season.". When the wind vectors turn clockwise with height as in this case, the wind is said to "veer" with height. If the wind vectors turn counterclockwise with height, they are said to "back" with height. |
| The next step in constructing the hodograph is the connect the tips of the wind vectors with a straight line segment as shown in red in Figure 2. Connecting the tips of the vectors shows the clockwise bend to the wind vectors with height. |
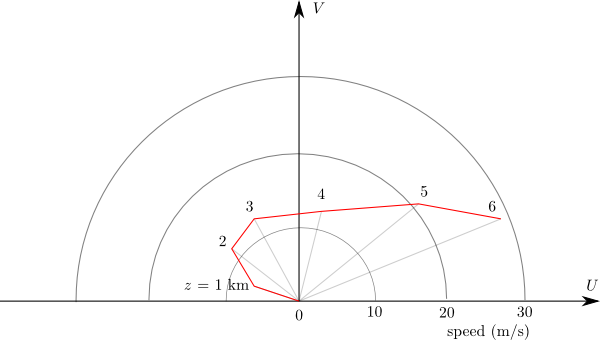
Figure 2. The tips of the wind vectors are connected by line segments shown in red. This is the hodograph. |
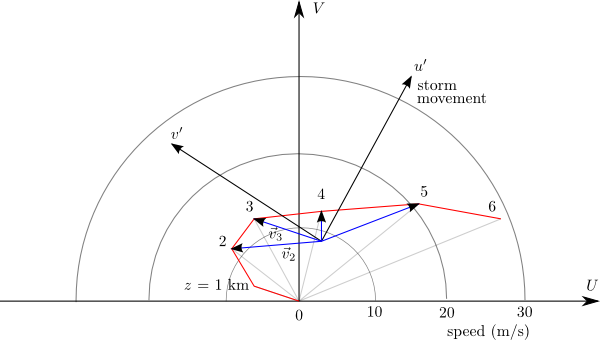
Figure 3. The storm movement is depicted by the vector $u'$. |
The storm direction is determined by the average velocity and is represented by the $u'$ vector in Figure 3.. New coordinates are drawn to represent "storm relative coordinates." The blue vectors shown the storm relative environmental wind vectors at the elevations of 2, 3, 4, and 5 km. Vectors $\vec{v}_2$ and $\vec{v}_3$ are labeled because they are used to determine the magnitude of the storm relative vertical wind shear given by $\frac{\Delta u}{\Delta z}$ that translates into the streamwise vorticity with a horizontal axis aligned with the lower-level flow stream into the developing cell. |
| Figure 4 shows how the vertical wind shear given by vectors $\vec{v}_2$ and $\vec{v}_3$ generates vorticity in the vertical plane perpendicular to the horizontal inflow stream near the surface. If this stream is lifted by a convective cell, the horizontal vorticity axis is transformed into a vertical axis. |
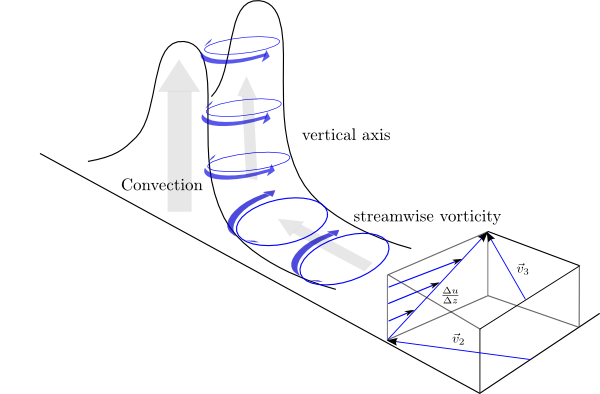
Figure 4. Vertical wind shear translates to streamwise vorticity. |