
Module Print Version
Table of Contents
- Introduction
- What Changes Climate?
- Is It Real?
- How Do We Know?
- Why Should We Care?
- Only a Few Degrees?: Why It Matters
- Only a Few Degrees?: Weather in a Changing Environment
- Only a Few Degrees?: Hotter Summers/Warmer Winters
- Only a Few Degrees?: Droughts and Floods
- Only a Few Degrees?: Sea-Level Rise
- Only a Few Degrees?: Extreme Weather
- Other Effects: Ocean Ecosystems
- Other Effects: Health
- Other Effects: Economics
- Other Effects: Security
- Other Effects: Regional Impacts
- How Sure Are Scientists?
- What Next?
Introduction
Global warming, the greenhouse effect, climate change...these buzzwords have been echoing through the media for years now. We're constantly bombarded with images and stories.
Melting glaciers all over the globe and sea ice that diminishes every summer...sea creatures that can't survive in warmer waters and decreasing fish stocks that threaten the livelihood of those who depend on them...raging wildfires and heat waves that kill or sicken thousands of people...changes in disease patterns that make humans more susceptible to serious illnesses...more devastating floods in some areas and longer droughts in others...
These events all have a dramatic impact on society and modern life, and projections by climate scientists suggest that topics like these will continue to be in the headlines.
However, as with much of science news, there are often stories that seem contradictory and confusing.
To sort this out and understand the background behind these stories, we need to answer questions like:
- Is climate change real? Can humans really alter Earth's climate, and how does that fit with our knowledge of how climate has changed naturally throughout history?
- How do we know? How have scientists come to their current understanding of climate change?
- Why should we care? What are the things that might change in the future that will affect us and future generations?
- How sure are the scientists? How much agreement is there among them?
- And, what steps can we take next?
Scientists have been working to answer these questions for decades.
In some ways, it's like putting together a giant puzzle. Each individual piece tells you little, but as the pieces are assembled, the puzzle becomes a recognizable picture, even if some parts are still unfinished. Today most climate scientists agree that the puzzle pieces clearly show that human-induced climate change is happening.
In this module, we'll dump all the pieces out on the table to let you look at them, explore how scientists are fitting them together, and see where a few are still missing.What Changes Climate?
Climate Influences: The First Inkling
Around 1900, a respected Swedish scientist named Svante Arrhenius published a series of papers and a book that included a crazy-sounding prediction. He and a colleague were studying the carbon cycle by estimating the changes in carbon dioxide (or CO2) produced by natural processes such as rock weathering, volcanic eruptions, and ocean absorption.
He also looked at a source no one had thought of before—humans. Was it possible that humans could change the climate? Arrhenius took his colleague's calculations of carbon emissions from human activities and crunched the numbers.
When atmospheric carbon doubled, he figured, it would be enough to raise Earth's temperature 9-11°F (5-6°C), but it would take thousands of years to do it at 1896 rates. By the time his book on the subject was published in 1908, so much more coal was being burned, Arrhenius revised his estimate to centuries. But he reasoned that a warmer climate would be a GOOD thing—understandable, perhaps, given his home in Stockholm, a few hundred miles shy of the Arctic Circle.
Although Arrhenius went on to win the Nobel Prize for Chemistry in 1903, his carbon calculations faded into obscurity. In the hundred years since Arrhenius made his estimate—remarkably close to today's best figure—scientists hotly debated the causes of past and current climate change. However today, most climate scientists agree that multiple lines of evidence clearly show that human-induced climate change is taking place.
Climate Influences: Natural Factors
Earth's climate shifts over time because so many different land, ocean, and space phenomena have a hand in it. The sun is the main driver of Earth's climate, as it provides most of the energy. The sun's energy output increased about a tenth of a percent from 1750 to 1950, which contributed about 0.2°F (0.1°C) warming in the first part of the 20th century. But since 1979, when we began taking measurements from space, the data show no long-term change in total solar energy, even though Earth has been warming.
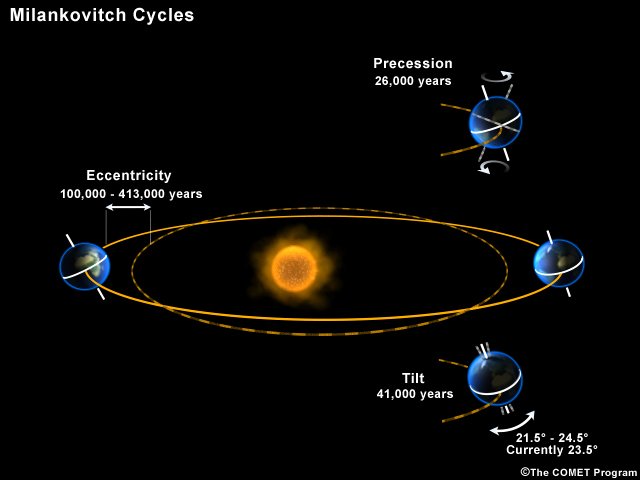
Repetitive cycles in Earth's orbit can influence the angle and timing of sunlight. The tilt and wobble of Earth's axis and the degree to which its orbit is stretched produce the Milankovitch cycles, which scientists believe triggered and shut off ice ages for the last few million years. But these changes take thousands of years, and so cannot explain the warming in this century.
Click to open a drifting continents & ocean currents animation.
Drifting continents make a big difference in climate over millions of years by changing ice caps at the poles and by steering ocean currents, which transport heat and cold throughout the ocean depths. These currents in turn influence atmospheric processes. Snow and ice on Earth also affect climate because they reflect more solar energy than darker land cover or open water.
Huge volcanic eruptions can cool Earth by injecting ash and tiny particles into the stratosphere. The resulting haze shades the sun for a year or two after each major blast. Dust and tiny particles thrown into the air by both natural processes and human activities can have a similar effect, although some absorb sunlight and help heat the climate.
Greenhouse gases, which occur both naturally and as a result of human activities, also influence Earth's climate.
Climate Influences: Greenhouse Effect
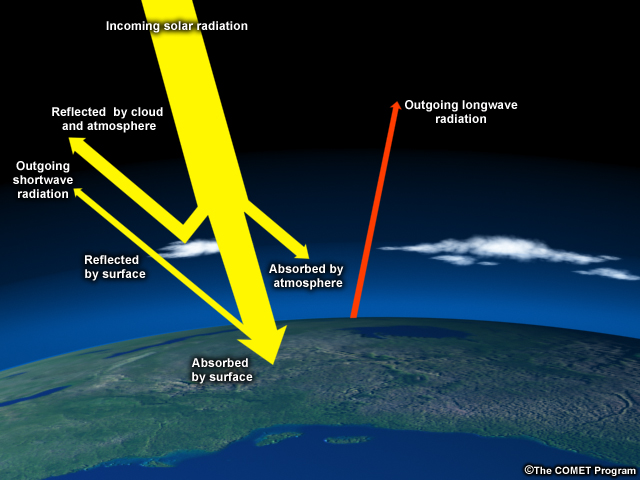
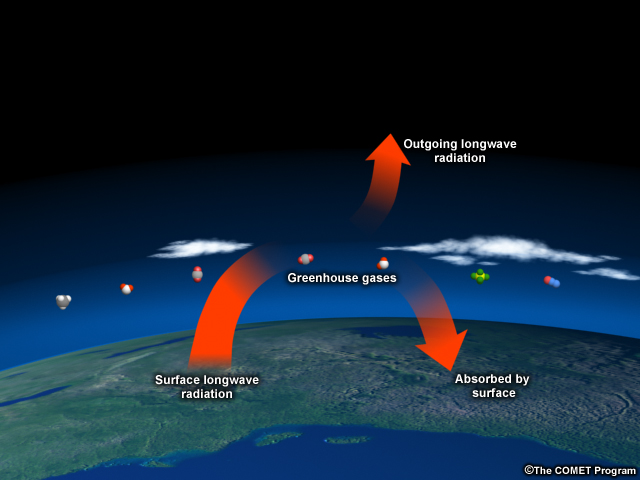
Earth's surface absorbs heat from the sun and then re-radiates it back into the atmosphere and to space.

Much of this heat is absorbed by greenhouse gases, which then send the heat back to the surface, to other greenhouse gas molecules, or out to space. This is commonly called "the Greenhouse Effect" but "the blanket effect" may be more appropriate. Though only 1% of atmospheric gases are greenhouse gases, they are extremely powerful heat trappers. By burning fossil fuels faster and faster, humans are effectively piling on more blankets, heating the planet so much and so quickly that it's hard for Mother Nature and human societies to adapt.
Though carbon dioxide gets the most press, it's certainly not the only greenhouse gas, nor even the most powerful. However, humans produce more of it than any other greenhouse gas, and it's very long-lasting (50-100+ years). In the United States, CO2 comprises more than 80% of total greenhouse gas emissions.
Example of Human-Produced Greenhouse Gases |
||||
| Global Warming Potential (Relative to CO2) | ||||
| Species | Lifetime (years) | 20 years | 100 years | 500 years |
| Methane | 12+/- 3 | 56 | 21 | 6.5 |
| Nitrous Oxide | 120 | 280 | 310 | 170 |
| Sulfur hexafluoride | 3,200 | 16,300 | 23,900 | 34,900 |
| Carbon tetrafluoride | 50,000 | 4,400 | 6,500 | 10,000 |
The other greenhouse gases are both natural and human-made. The most common are methane, nitrous oxide, ozone, fluorinated gases, and water vapor. Methane, for example, is only about 8% of U.S. greenhouse gas output, but is 21 times more powerful than carbon dioxide per molecule, although it does not stay in the atmosphere as long. It is produced naturally in wetlands, melting permafrost, termites, belching cows, and by human activities, such as fossil fuel production, landfills, and rice cultivation.
Water vapor is by far the most important gas in the natural greenhouse effect, contributing 60% of the effect to carbon dioxide's 26%. Human activities don't directly increase water vapor. Instead, warming produced by other gases, such as CO2, increases evaporation and allows the atmosphere to hold more water vapor. And in fact, satellites have detected an increase in atmospheric moisture over the oceans at a rate of 4% per degree F of warming (7% per degree C) since 1988. This additional water vapor then adds to the warming because water vapor is a greenhouse gas. More water vapor can also produce more clouds, which have a complicated effect of both cooling the atmosphere by reflecting light and warming it by trapping heat below the clouds.
The main factors that determine the effect of greenhouse gases on climate are:
- The amount and rate of greenhouse gas emissions
- The effectiveness of each gas in trapping heat, and
- The length of time each gas stays in the atmosphere (for example, CO2 lingers in the atmosphere for hundreds of years)
Other greenhouse gases like water vapor are more powerful on a molecule for molecule basis, but the flood of manmade carbon dioxide emissions into the atmosphere this century and its atmospheric staying power are why carbon dioxide is the focus of concerns.
Climate Influences: The Carbon Cycle
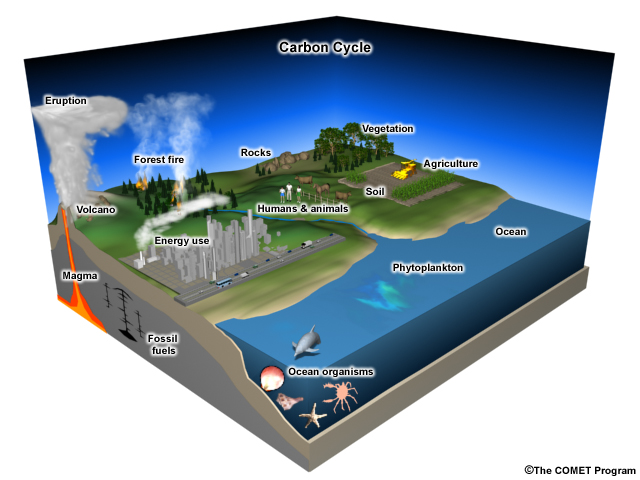
Carbon dioxide isn't stuck in the atmosphere once it gets there. It moves into and out of living organisms, soil, rock, and water. For example, plants take up carbon dioxide in the air to make wood, stems, and leaves, and then release it back into the air when the leaves fall or the plants die. Forest fires release large amounts of CO2, providing an important reason to preserve forests. Animals, including humans, take up carbon when they eat plants, and then release CO2 back into the atmosphere via respiration.
Over very long time frames, the weathering of rocks can add carbon to surface waters that run into the ocean. Eventually, this carbon is removed from the water and forms limestone. It can later be released back into the atmosphere from volcanoes when the rock is melted.
In ancient times when Earth had a much warmer climate, huge swamps buried plant material faster than it could decay, and when the buried remains were subjected to heat and pressure, they became coal. In similar ways, microorganisms buried on lake and sea bottoms throughout Earth's history produced oil. These processes locked up lots of carbon as oil, gas, and coal. By burning these fuels in the last 150 years, we have suddenly released into the atmosphere carbon that took hundreds of millions of years to store.
Climate Influences: Past Climates
Certainly, temperatures in Earth's past have been higher (and lower) than today, and
CO2 concentrations have varied considerably. At certain times, changes in the Earth's orbit caused warmer temperatures, which increased CO2 and produced additional warming in a feedback process. But today, the CO2 released by human activities is triggering the increase in temperatures.
What Do You Think?
How does the 2008 concentration of CO2 compare to the highest concentration observed during the last 800,000 years?
a) Higher than the highest peak (more than 300 parts per million atmospheric molecules [ppm])
b) About the same as the highest peak (about 300 ppm)
c) About the same as the lowest level (about 180 ppm)
d) In between the lowest and highest levels (about 240 parts per million)
Answer: The correct answer is a). The average 2008 CO2 concentration recorded at Mauna Loa, Hawaii was 385.3 ppm. Compare that to the high value of 300 ppm found in the 800,000-year long ice core record. Not only is today's concentration higher, the increase is occurring much faster (over about a century) than past CO2 spikes, which generally happened over several thousand years.
What makes all this worrisome is that we are pushing the system out of the range human civilization has adapted to. The last time the poles were this warm was about 125,000 years ago during the last period between ice ages. The warming we saw in the 20th century happened 10 times faster than the climb out of the last ice age.
Climate Influences: Natural Variability
Weather varies naturally because of many factors, and those factors can combine to produce an extreme drought or a devastating flood, stronger hurricanes or record snowfalls. Extremes in weather are nothing new.
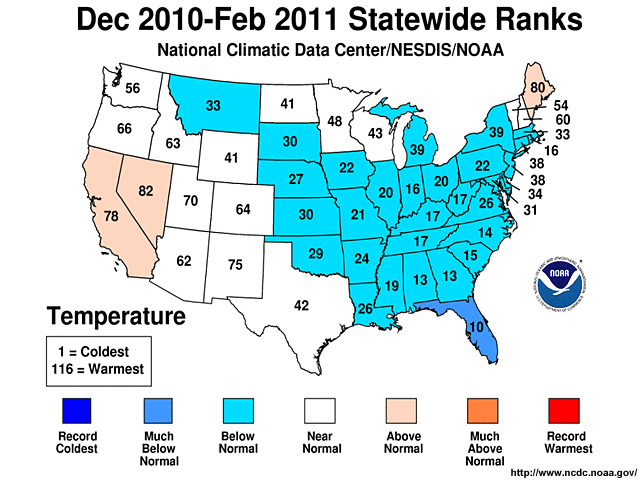
Sometimes, the same general climate pattern can produce drastically different weather conditions in different locations or different years. For example, the unusually cold winter of 2010-2011 in the contiguous U.S. was influenced by a La Niña patterna quasi-cyclic cooling of the eastern tropical Pacific Ocean.
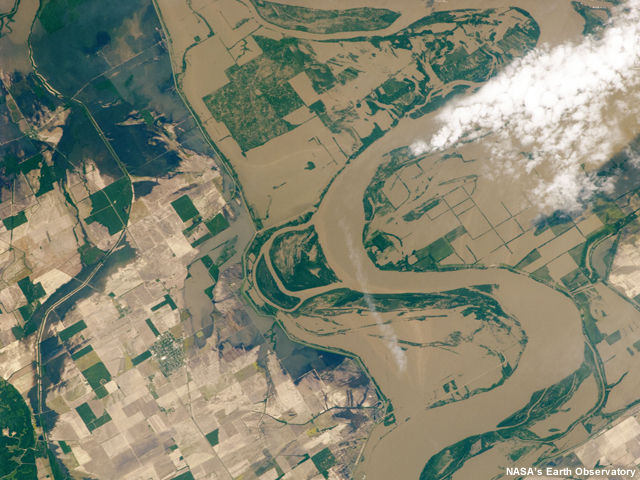
It is very likely that this pattern contributed to an unusually cold spring with heavy precipitation in the Upper Missouri River Basin. Heavy rains in May fell on deep late-spring snow pack, which caused flooding that devastated parts of several states.
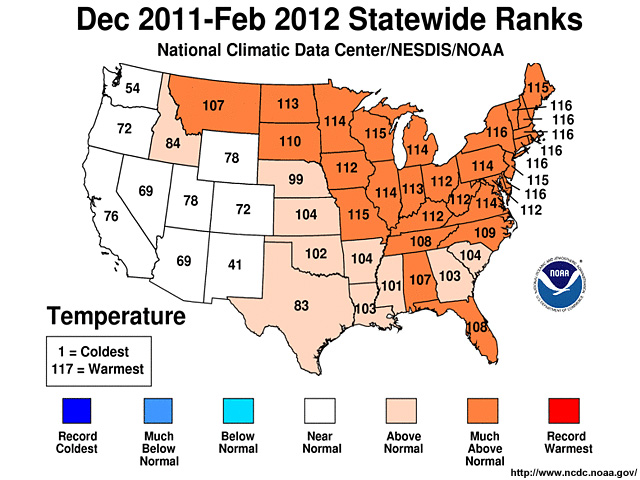
No two El Niño/La Niña-Southern Oscillation events are alike, however. The La Niña pattern persisted through the winter of 2011-2012, although it was somewhat weaker. Surprisingly, that winter was one of the warmest on record in the U.S. A number of factors conspired to produce the two dramatically different results. Part of the difference related to the high latitude pressure patterns (called the Arctic Oscillation) that dominated in the two winters. In the warmer 2011-2012 winter, the pattern tended to trap the cold air near the poles, but why that was the case is still being studied.
Click to open a land surface temperature anomaly animation.
We have a good understanding that natural modes of climate variability affect the probability and intensity of weather extremes. So how does global warming come into the mix? In some cases it can mitigate extremes. For example, a record cold winter might be a little less cold than it otherwise would have been. However, climate change could also amplify the effects of a natural cycle, producing more severe extremes. So, for example, a natural pattern that produces warmer-than-normal annual conditions could be enhanced by global warming and result in increased night-time temperatures and more frequent heat waves.
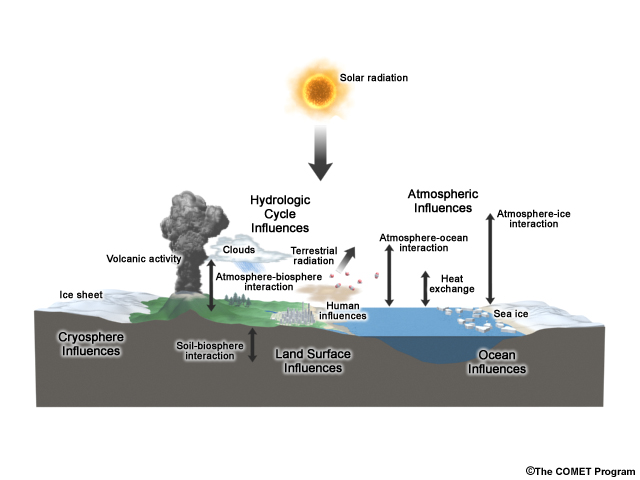
Climate is determined by a complicated interplay of many factors that affect the oceans, land surfaces, and the atmosphere. A change in one of themsuch as increasing atmospheric concentrations of greenhouse gasescan ripple throughout the system.
Is It Real?
Evidence of Change: Temperatures
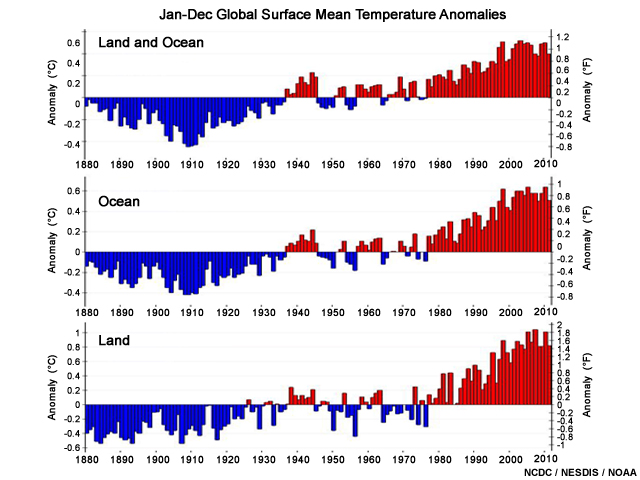
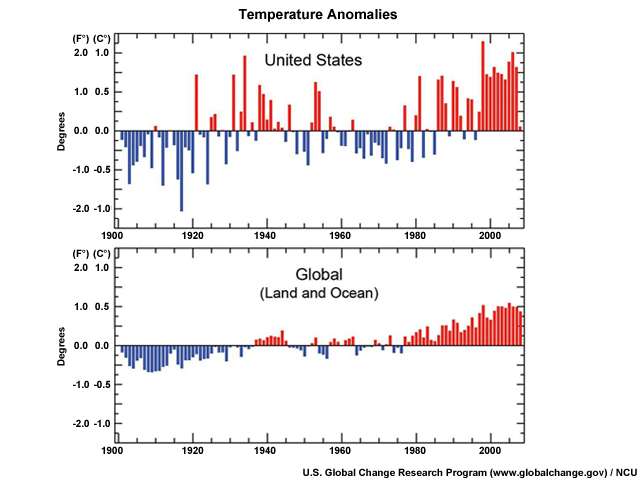
Earth is getting warmer by virtually every measure we know, and the temperature has been well above normal for more than 25 years. Although increases of 1.0-1.6°F (0.6-0.9°C) over the last century or so may not sound very threatening, remember that's a global average. The warming is stronger over land than over oceans and in the higher latitudes than in the tropics.
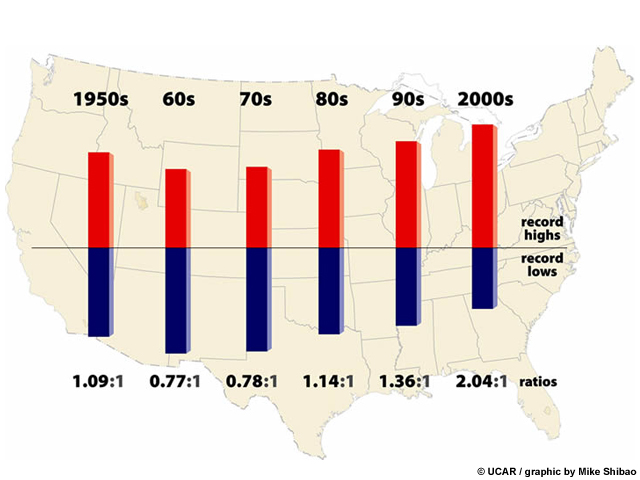
In the United States, this warming is also changing the temperature patterns. Record high temperatures are now occurring more than twice as often as record lows, and similar patterns have been observed across the planet.
What Do You Think?
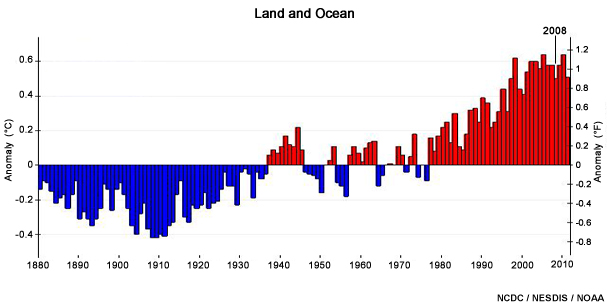
Looking at the graph, what can you conclude about the 2008 temperatures?
a) 2008 was the coolest year since 2000
b)
2008 was warmer than any year before 1990
c)
Global warming has ended
d)
Worldwide CO2 emissions dropped significantly in 2008
e)
Temperatures in 2008 are consistent with global warming
Answer: The correct answers are a), b), and e). While 2008 was relatively cool compared to the other years so far in this century, it was still one of the warmest years since 1880.
But why did the temperature decrease in 2008?
Let's look at the global map of surface temperature anomalies for the year.
Notice that much of the world (and especially the Arctic) was warmer than normal (red and orange colors), although the U.S. was fairly close to normal. This illustrates the idea that you can't just look at the weather in one area—you need to see the picture over the entire planet.
Note also the large pool of cooler (blue and green) temperatures in the Pacific Ocean. These lower temperatures reflect a strong La Niña pattern, a naturally occurring oscillation of tropical ocean temperatures that also shape weather patterns. So how did the 2008 La Niña affect the picture?
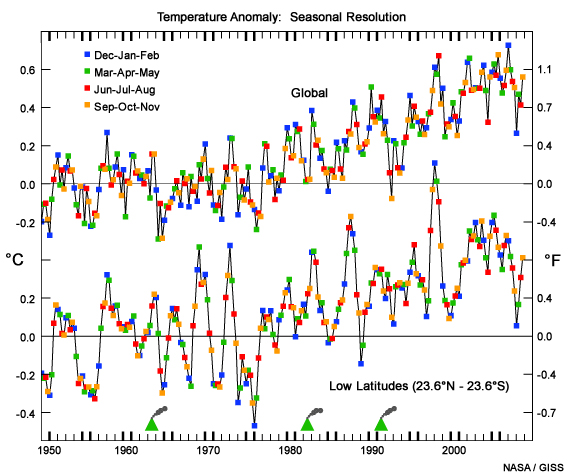
Looking at the seasonal temperatures, we can see that the La Niña cooling cycle was strongest in the low latitudes and that it bottomed out in the winter (December 2007 through February 2008). Once the La Niña pattern relaxed, temperatures bounced upward again. This is a good example of natural climate variability superimposed on the global warming signal.
Evidence of Change: Oceans
Ships, buoys, and satellites that dot the globe tell us the oceans are heating up too. The top 1,000 feet (300 meters) or so of the ocean have warmed by 0.5°F (0.3°C) over the past 50 years. The deep sea, too, has warmed. A NOAA study that looked at the period from 1948 to 1998 found that every ocean warmed to at least 3,300 feet (1,006 m).
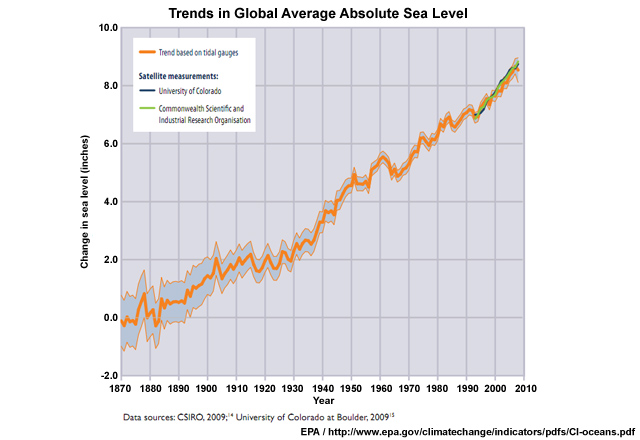
And as air and oceans warm, the seas have risen. All together, the IPCC estimates the oceans rose 4 to 10 inches (10-25 cm) in the 20th century from melting ice and snow and the physical expansion of warmer water. The average rate of increase has been 0.06 in. (0.15 cm) per year from 1870 to 2008. From 1993 to 2008, average sea level rose roughly twice as fast as the long-term trend, at a rate of about 0.12 in. (0.30) per year.
Sea levels aren't the only way oceans change. Seawater, which is normally alkaline, is becoming less so as extra CO2 in the air is absorbed. When the gas dissolves in the ocean, it reacts with carbonate ions to form carbonic acid. As a result, the oceans are now 30% less alkaline than they were just 100 or so years ago.
Though that doesn't sound like a big deal, it means times will be much harder for ocean creatures like coral, plankton, and shellfish that depend on abundant carbonate ions as raw material for shell-building. If populations of these organisms plummet, the fish that eat them and the millions of people that eat the fish will suffer as well.
Evidence of Change: Snow and Ice
Snow and ice reflect the sun's energy back to space. Without this white cover, more water can evaporate into the atmosphere where it acts as a greenhouse gas, and the ground absorbs more heat. Snow and ice are melting at rates unseen for thousands of years, and this has profound climate consequences. As with air temperature, most of the melting in our 100 years or so of official record keeping has occurred after 1980.
Spring snow cover has decreased since 1922 at an average rate of about 2% per decade in the Northern Hemisphere, including a steep 5% drop during the 1980s. River and lake ice don't last as long as they used to either. As permafrost melts in the vast northern tundra, trees locals colorfully call "drunken trees" are falling over and buildings are crumbling as the ground disintegrates beneath them.
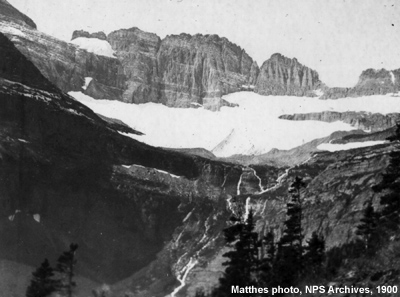
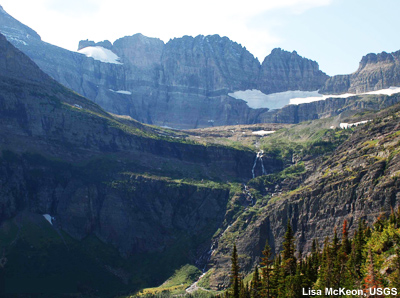
With a few exceptions, glaciers have been shrinking across the globe. In Glacier National Park, for example, there were 150 glaciers in 1850. Today, there are 26. In Switzerland, the Tortin Glacier, which supported a local ski area, shrank so much that the Swiss put a city-block sized insulating sheet over the glacier's edge to slow its retreat.
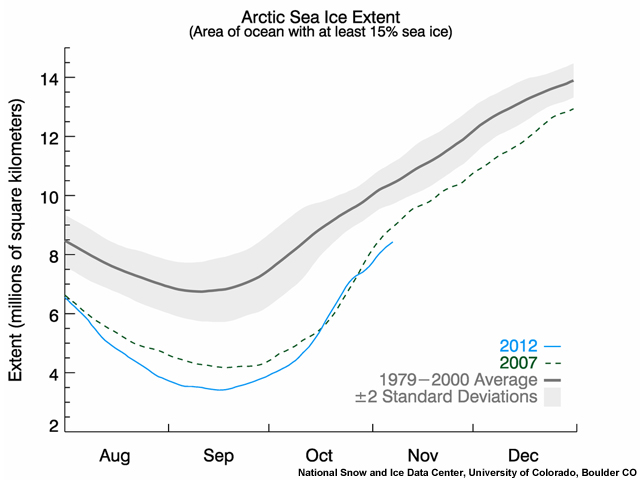
Sea ice is dwindling too, especially in the Arctic. Satellites have observed winter Arctic sea ice shrink by about 3-4% per decade from 1979, and an even higher rate in summer.
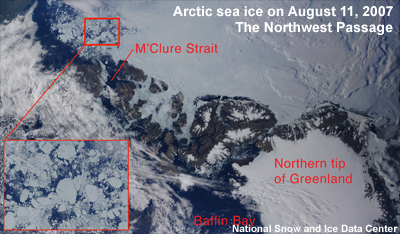
In summer 2007, the Northwest Passage north of Canada became navigable for the first time as the polar cap melted to its lowest level to that date30 years faster than IPCC scientists had predicted.
Evidence of Change: Rain and Drought
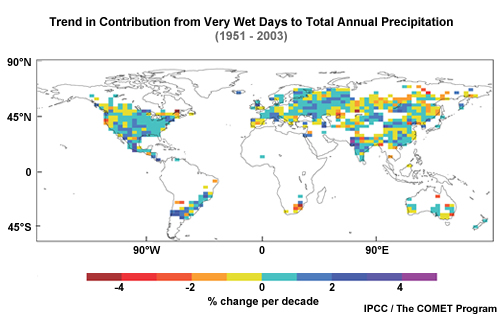
More water vapor held by a warmer atmosphere also leads to heavier rains and more snowfall. In particular, heavy rains are increasing in temperate zones. For example, in the continental United States, intense precipitation increased by 20% over the past century, while total precipitation increased 7%.
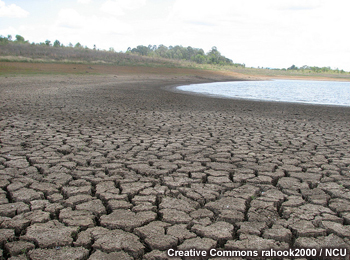
More evaporative power doesn't just mean more rain—paradoxically, it also means that some areas get drier as storm tracks shift. A 2004 study by the National Center for Atmospheric Research found that the percentage of Earth's land experiencing serious drought had more than doubled since the 1970s.
And, along with drought, wildfires have become more widespread recently across the U.S. and Canadian West.
Evidence of Change: Ecosystems
Increased warmth has also affected living things. Plants and animals are experiencing longer growing seasons across the Northern Hemisphere. For example, the Japanese keep very detailed records on the blossoming of their Tokyo cherry trees, so they know they are blooming 5 days earlier on average than they were 50 years ago.
Mosquitoes, birds, and insects are also moving north in the Northern Hemisphere. The pine beetle, a native pest of lodge pole and jack-pine trees, has chewed up tens of thousands of square miles of forest across North America, staining the green forest with the rust of dead needles. A 2008 Nature article attributed their move northward and to higher elevation forests to warmer winters, hotter summers, and less rain. To make matters worse, the scientists projected that the beetles themselves could become a force for climate change. For example, the carbon released by the decay of the trees they have killed in British Columbia may cause the forest to emit more carbon than it absorbs.
Evidence of Change: U.S. Regions
As is true over the rest of the planet, the United States has been warming, particularly in the last 50 years. Scientists have determined that much of this comes from the heat trapped by greenhouse gases emitted through human activities, such as the use of fossil fuels. Overall the average warming in the U.S. has been about 1.7°F (0.95°C) since the late 1800's.
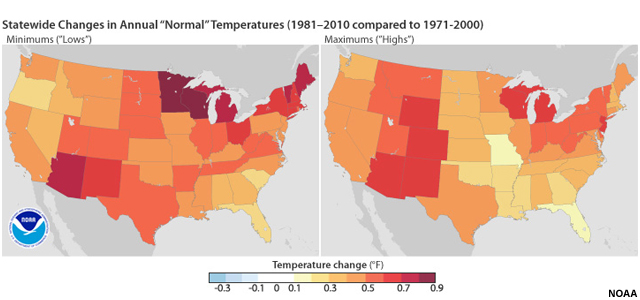
Recently, the National Climatic Data Center issued its new Climate Normals data30-year averages of climatological variables (such as temperature and precipitation) that serve as reference points. These are used for everything from energy use projections to choosing crops and planting times. This graphic depicts the differences between the new normal, which averages annual temperatures for the period from 1981-2010, and the previous 30-year average that ended in 2000. The graphics indicate that, on an annual basis, every state has experienced warming in both the minimum temperatures (shown on the left) and the maximums (on the right), although some have warmed more than others. Average annual lows are now warmer, particularly in the desert Southwest, the Northeast, and the Great Lakes. Daytime highs have increased the most in the Southwest, Rocky Mountains, and Michigan, Wisconsin, and New Jersey.
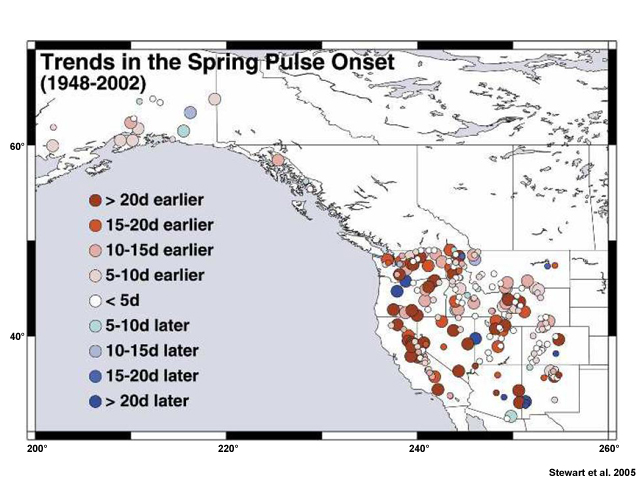
Increasing temperatures can also affect the timing of spring or early summer runoff. For many western rivers, the initial pulse of water from snowmelt is occurring about 2-3 weeks earlier. Although some of these changes can be explained by natural variability, it appears that most of the shift is probably due to global warming.
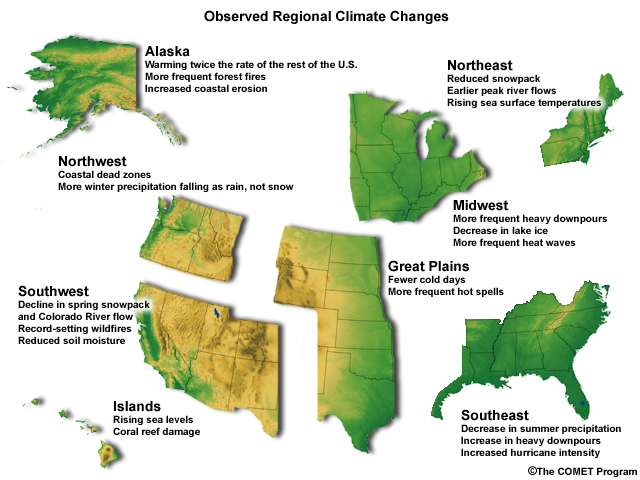
Climate systems, ecosystems, and even human systems are interrelated in many complex ways, so it is not surprising that a change in one of them affects others. This graphic shows just a few of the regional changes that have already been observed. If greenhouse gases continue to accumulate in the atmosphere, we can expect even more impacts. Some of these can be beneficial, but many can be problematic, and the effects can vary from location to location.
The Human Element: CO2
In pre-industrial times, carbon dioxide made up about 280 parts per million atmospheric molecules. In 2008, it makes up about 385 parts per million—30% more. So what's the big deal about a few hundred parts per million? Not only is the present atmospheric carbon dioxide concentration higher than it has been for at least 800,000 years, the rate of change is accelerating. Previously it never exceeded 30 parts per million per thousand years, but now, carbon dioxide has risen by 30 parts per million in the last 17 years.
Worldwide, burning fossil fuels is the major source of CO2, but CO2 can also come from cutting trees, burning forests or grasslands, agriculture, and interestingly, making cement.
What Do You Think?
What country or group of countries had the highest total CO2 emissions in 2007?
a) United States
b)
China
c)
Russia
d)
Japan
e)
European Union-15 (Austria, Belgium, Denmark, Finland, France, Germany, Greece, Ireland, Italy, Luxembourg, Netherlands, Portugal, Spain, Sweden, United Kingdom)
f)
Other large developing countries (Brazil, Mexico, South Africa, Saudi Arabia, India, and Iran)
Answer: The correct answer is b).
According to data from the Netherlands Environmental Assessment Agency, China passed the U.S. in 2006 and is now the largest emitter of CO2. Notice that the combined emissions of the EU-15 group and the large developing countries group are lower than the U.S. emissions.
What Do You Think?
What country or group of countries had the highest per capita CO2 emissions in 2007?
a) United States
b)
China
c)
Russia
d)
India
e)
European Union-15 (Austria, Belgium, Denmark, Finland, France, Germany, Greece, Ireland, Italy, Luxembourg, Netherlands, Portugal, Spain, Sweden, United Kingdom)
Answer: The correct answer is a).
On a per person basis, the United States, with a population of 0.31 billion people, emits more than twice as much as the citizens of the EU-15 and about 10 times as much as 1.14 billion people in India.
The Human Element: Other Greenhouse Gases
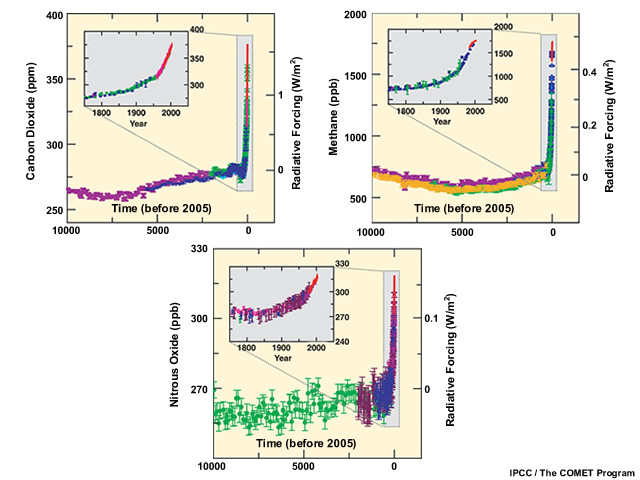
Carbon dioxide isn't the only greenhouse gas climbing alarmingly fast. Methane is now about 1,780 parts per billion. During the last 650,000 years, it never exceeded 790 parts per billion. And worryingly, methane has begun building up in the atmosphere again after stabilizing between 1999 and 2006. Some evidence points to melting permafrost across the Northern Hemisphere, where decaying plant material produced methane that was frozen in the tundra for millennia.
Nitrous oxide (N20) is another greenhouse gas produced by both natural and human-related sources. Less of this gas is emitted than CO2, but it is a more powerful heat trapper on a per molecule basis and has an atmospheric lifetime of 120 years.
Some industrial chemicals, such as fluorinated gases, are considered to be "high global warming potential gases" because of their potency and long atmospheric lifetimes. For example, nitrogen trifluoride, a cleaning agent used in making flat panel TVs, computer monitors, and thin-film solar panels, has increased 30-fold since 1978 and is thousands of times more powerful as a greenhouse gas than carbon dioxide.
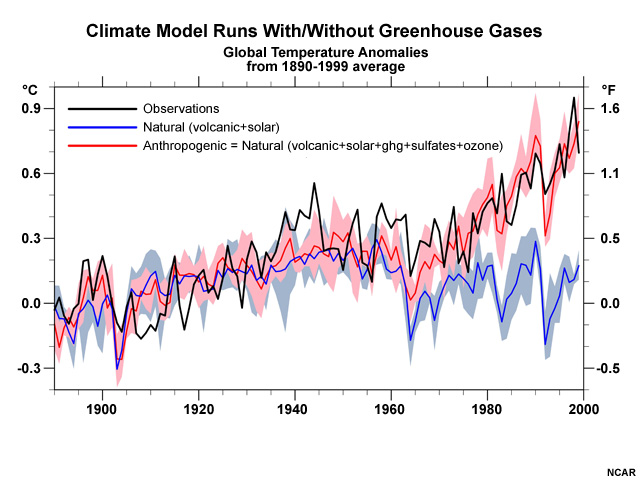
The Human Element: Are Humans the Cause?
But couldn't the warming still be a natural variation? Scientists have looked for alternative explanations based on what caused climate changes in Earth's past. None of them fit the bill. Computer models help cinch the case for a human cause. The solar and volcanic conditions of the last 50 years would likely have produced cooling, based on our models' best estimates. Only the addition of the extra greenhouse gases and particles to our computer models can reproduce the pattern of warming we've seen over the past century.
How Do We Know?
The Experts: IPCC
Figuring out what influences climate, how it has changed in the past, whether it's changing now, and how it might affect our future has required the expertise of thousands of scientists and other experts from dozens of fields who were brought together in one body: the IPCC.
Since it was formed in 1988, the IPCC's purpose has been to bring together the experts who can provide decision makers and others with an objective source of information. It does not, however, conduct any research itself. The IPCC's Assessment Reports (issued in 1990, 1995, 2001, and 2007) also don't tell us what to do. They discuss options, but leave prescribing policies for dealing with climate change up to individual nations.
But who are the experts involved in the IPCC and what do they do? These specialists (more than 2,000 of them) represent about 140 countries, a variety of fields, and a range of views. Their function is to assess the latest peer-reviewed literature and to achieve consensus about where the weight of the evidence points and where uncertainties lie.
Remember that this means they are looking at papers that have already been reviewed in depth by other experts before the articles were published in a scientific journal. For the 2007 Report, they examined 29,000 data sets. The assessment also included computer modeling to determine the cause of climate change and to predict future impacts.
Levels of Confidence |
|
| Terminology | Degree of confidence in being correct |
| Very high confidence | At least 9 of 10 chances of being correct |
| High confidence | About 8 of 10 chances |
| Medium confidence | About 5 of 10 chances |
| Low confidence | About 2 out of 10 chances |
| Very low confidence | Less than 1 out of 10 chance |
Likelihood Scale |
|
| Terminology | Likelihood of occurrence/outcome |
| Virtually certain | >99% probability of occurrence |
| Very likely | >90% probability |
| Likely | >66% probability |
| About as likely as not | 33-66% probability |
| Unlikely | <33% probability |
| Very unlikely | <10% probability |
| Exceptionally unlikely | <1% probability |
The IPCC was very careful in its use of language. Phrases such as "likely" and "low confidence" have very specific meanings. For example,
Similarly, expressions of the likelihood of something occurring are also well-defined:
So when the IPCC states, "Changes in snow, ice and frozen ground have with high confidence increased the number and size of glacial lakes," the phrases mean that the scientists believe there is an 8 out of 10 chance the statement is correct.
The Experts: Other Experts
The IPCC isn't the only group that has taken up the question of climate change. In the U.S., many government agencies (such as the National Oceanic and Atmospheric Administration [NOAA], National Aeronautics and Space Administration [NASA], and Environmental Protection Agency [EPA]), non-profits like the National Center for Atmospheric Research (NCAR), and universities have groups that work on climate change.
The U.S. Climate Change Science Program is tasked with integrating federal research on climate and global change and has produced a number of reports on climate. In addition, the National Academy of Sciences (NAS), which was created in 1863 to provide independent advice to the U.S. government on scientific and technological issues, has also worked on the topic. All of these groups support the major conclusions of the IPCC.
Tools: Data: Paleoclimate
If you want to know what is changing climate now, it's helpful to understand what has changed it in the past. The record of the Earth's past climate comes from many different data sources
- Geology
- Atoms (called radionuclides) produced by cosmic rays
- Fossils
- Lake and ocean sediments
Other techniques that the general public is more familiar with include:
- Ice cores
- Tree rings
- Coral growth patterns
- Climate models

Ice cores: Ice cores drilled from deep within ice sheets or glaciers give us our longest look back in time—as far back as 800,000 years, so far. Analyses of the water molecules, air bubbles, and material such as ash and dust can provide information on local temperatures, greenhouse gases, volcanic eruptions, and other factors that influence climate.
Tree rings: Tree ring analysis (dendrochronology) looks at changes in the thickness of annual growth rings that are determined by seasonal and climatic variations of temperature, precipitation, or both. Dendrochronology is a very useful tool for looking at climate over the last 7,000 years or so. For example, tree rings have shown poor growth in years when ice cores indicate large volcanic eruptions, which shroud the sun and cool the earth.
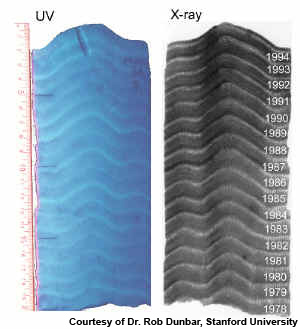
Coral growth patterns: The growth rate and density of coral skeletons also vary with temperature and other environmental conditions, so their growth patterns can be analyzed much like tree rings. The chemical composition of the coral in a particular ring provides information about sea surface temperatures, salinity, runoff, and upwelling.
Climate models: Climate models are used to test explanations for past and future climate changes. For example, a model run by NCAR looked at four periods— a warm period 250 million years ago, one of abrupt warming 55 million years ago, a glacial period about 21,000 years ago, and the Little Ice Age (about 500 years ago). Scientists found that the models produced changes similar to what actually happened. This gives scientists more confidence about using models to make future estimates.
Tools: Data: Observations
Scientists use many different tools to study present climate.
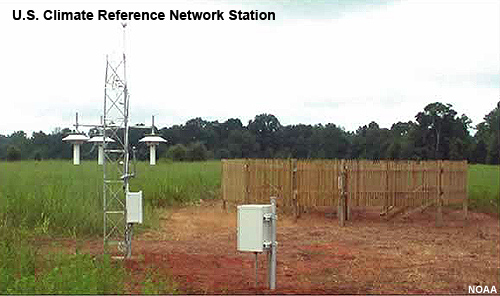
Surface observations: Three main climate centers—NASA, NOAA, and the University of East Anglia in the United Kingdom—each assess data from surface monitoring stations and calculate global average temperatures. While their methods differ, as do some of the finer details of their results (such as rankings of warmest years), they all agree that the 20th century has warmed about 1.4°F (0.8°C).
In addition to temperature, water and moisture measurements also tell us how the climate is changing. In order to evaluate patterns of precipitation and drought, scientists measure rain and snowfall, evaporation, soil moisture, and stream flow.
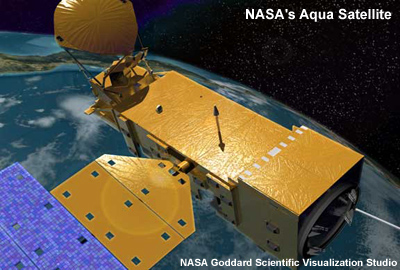
Atmospheric observations: Climate change doesn't just happen at the surface, so scientists look higher up in the atmosphere to see whether temperature, water vapor, clouds, and the sun's energy are changing. Data for these come mainly from satellite or weather balloon measurements.
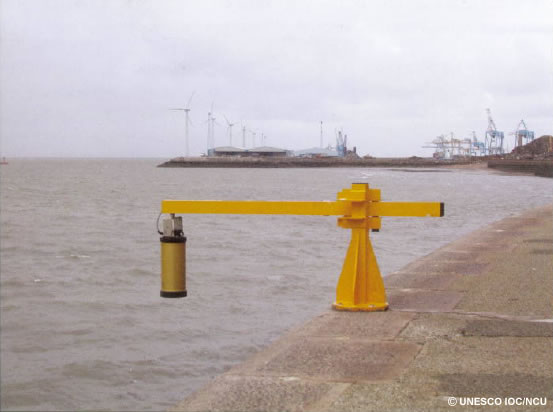
Ocean Observations: To understand sea level change, researchers compare multiple global datasets taken over several decades. They use various tools, including:
- Tide gauges, which measure and record sea level height;
- ARGO floats, a global array of 3,000 drifting profiling floats that measure the temperature and salinity of the upper 6,500 ft (2000 m) of the ocean; and
- Satellites that measure the topography of the ocean and monitor other important factors in sea level changes, including Earth's gravity field, sea surface temperature, and ocean salinity.
Researchers also look to the past to understand sea level. Historical records and radiocarbon dating of different sediments offer important clues about past sea levels, which in turn inform our understanding of present and future sea heights.
Tools: Models: What They Are
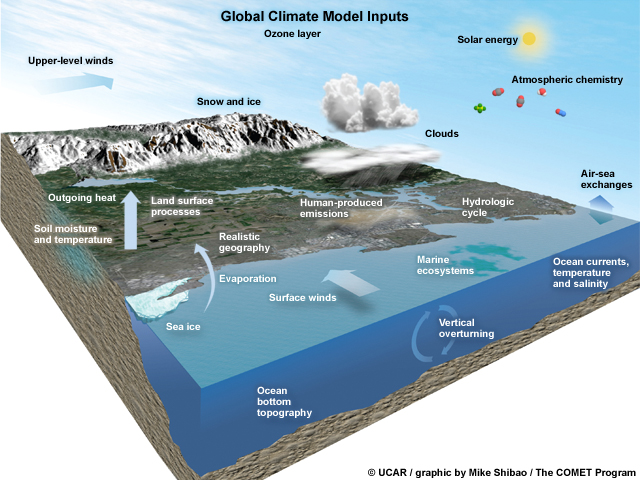
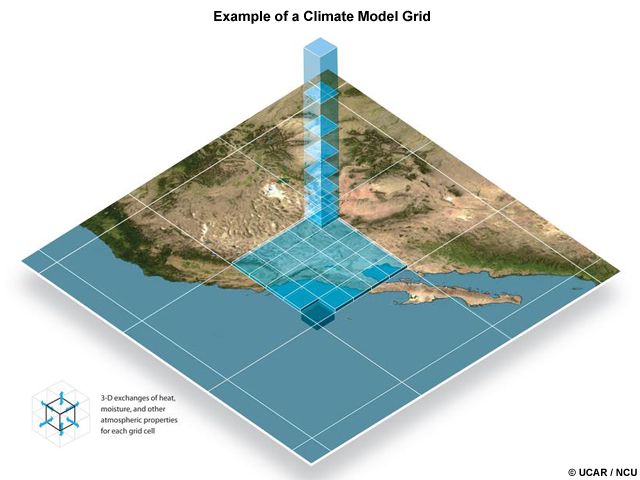
Global climate models simulate the chemical and physical processes that drive Earth's climate. These models are used to study Earth's past climate changes, and they are an important tool to check our understanding of how climate processes work. Models are also the only way we have to evaluate how the climate might change in the future. In other words, they are a big part of how we come to understand climate science.
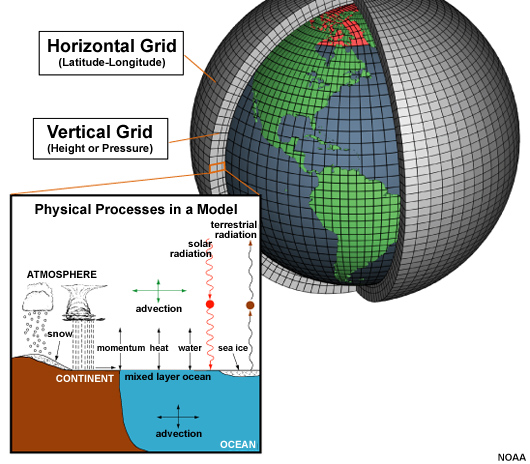
Much like the models that broadcast meteorologists use to issue weather forecasts, climate models simulate Earth's climate system with a 3-dimensional grid that extends through the land, ocean, and atmosphere. The grid may have 10 to 60 different levels in the atmosphere and surface grid spacings of about 60 by 90 miles (100 by 150 km)—the size of Connecticut. The models perform trillions of calculations that describe changes in many climate factors in the grid.
The models project possible climates based on scenarios that cover a range of assumptions about global population, greenhouse gas emissions, technologies, fuel sources, etc. The model results provide a range of possible impacts based on these assumptions.
In the 1960's when climate science was in its infancy, these models were relatively limited. New components and better resolution in the decades since have greatly improved the models. However, it's worth noting that even early on, the relatively crude models already showed many of the features that have been observed today, such as the greater warming in higher latitudes relative to lower latitudes.
Tools: Models: Uncertainties
Climate modelers are the first to point out that the models are imperfect, so it's reasonable to ask what the uncertainties are and whether, given those, we can trust models to provide useful predictions. Their main shortcomings are:
- Limited observations
- Incomplete understanding of climate processes and their interrelationships
- Imperfect model representations of the processes
- Relatively large grid boxes that don't represent smaller terrain features
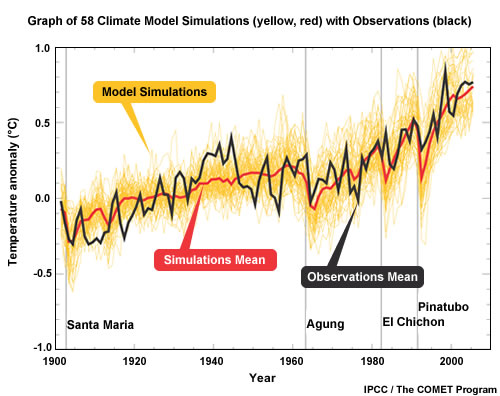
To determine whether climate models are useful and where problems might exist, scientists run tests to see how well the results match actual past temperature changes.
If the two don't match, then scientists have to figure out if there's a problem with the observations or with some component of the models. For example, a few years ago some of the satellite data did not show parts of the atmosphere warming at the same rate as models did. Eventually an error in the satellite data calculations was found, and now the two are in agreement.
Tools: Models: Climate and Weather Models
A common critique of climate predictions is, "If weather model forecasts aren't reliable more than a week out, how can models predict climate decades in the future?" While weather and climate models are based on similar physics, they are not predicting the same thing. Weather forecasts look at the day-to-day changes on a local level, while climate predictions are focused on longer term processes and global or regional scales. Subtle chaotic atmospheric variations make short-term weather forecasts difficult beyond 8-10 days. Climate models deal with the longer-term influences of the sun, oceans, land, and ice on the atmosphere. Predicting a temperature at a particular place at a particular hour is a different problem than projecting an average temperature in a large region or over the entire globe and over a year, decade, or century.
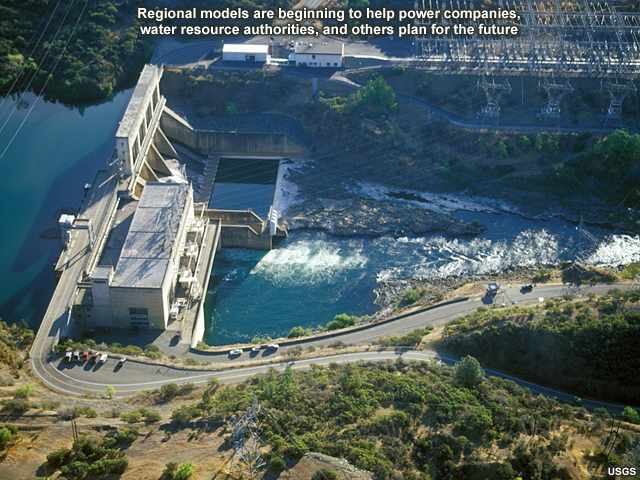
The bottom line is that models have shown a reasonably consistent picture of warming and its causes.Tools: Models: Regional Downscaling
Relating global climate change projections to regional, or even local, effects is critical for making policy and investment choices that can reduce the potential for future adverse climate impacts. However, it is not simply a matter of running a global climate model and looking at the results at a specific location.
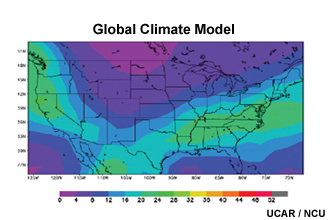
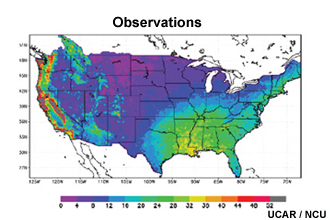
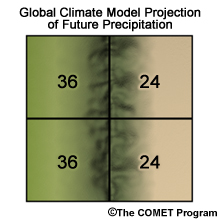
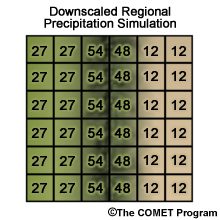
While global models are useful for understanding broad features of climate change, their resolution is too coarse to answer questions about smaller regions. In other words, the points at which a global model makes calculations are too far apart to see topographical features that often determine the finer structures in weather patterns. So, for example, the model results (top image) get the broad features correct, but miss many details that show up in the observations (bottom image). This is particularly true in the western U.S. where there is more varied topography. Global climate models can also miss other influences, such as those caused by the interface between sea and land.
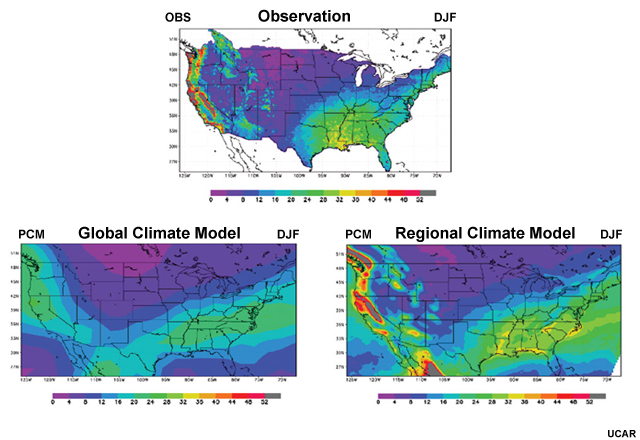
A technique known as "downscaling" takes global model output and uses it to provide information closer to the local level. Scientists use two basic methods: dynamical downscaling and statistical downscaling. So, in this example, a regional climate model (an example of dynamical downscaling) gives results that produce more realistic local-scale features that better replicate the observations.
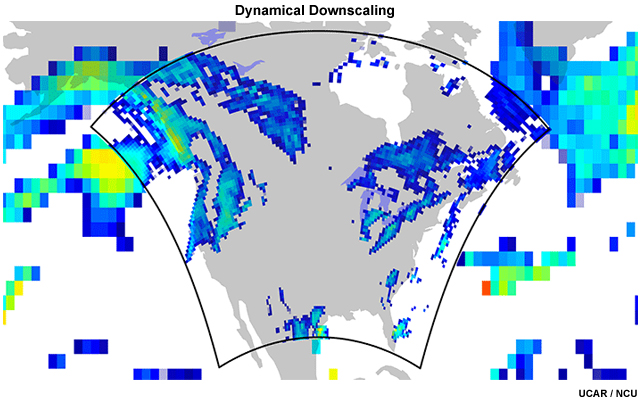
In dynamical downscaling, scientists nest a regional climate model (shown in the center of this figure) within the output of a larger global-scale climate model (indicated by the larger pixels on the edges). The nested regional climate model takes meteorological, oceanic, and land-surface data generated by the global climate model and makes a regional projection. Because regional models have a more limited scale, they can be run at much higher resolution (as shown by the smaller pixel sizes) than can be achieved by global models.
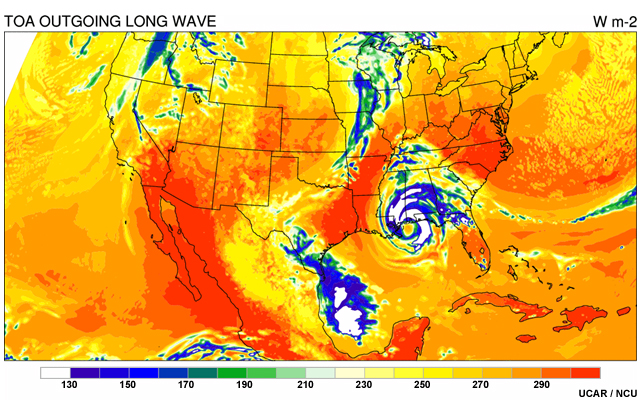
Nested regional climate models are improving every year and can even produce realistic depictions of weather features, such as this simulation of a possible future hurricane hitting the Gulf Coast. Some researchers downscale the results further by also using "weather-scale" models that can simulate individual storms. While these results are not intended as forecasts years in the future on a specific day, the models' ability to produce realistic weather indicates they can simulate features that affect broader weather patterns. Researchers then use simulations of specific events to establish statistical trends in such things as frequency of hurricanes per year over a multi-decadal period.
However, dynamical downscaling has its challenges. For example, small errors in the global climate model may amplify inside the nested domain and become major errors. Another weakness is the lack of productive cross-talk between the regional climate model and the global one. The regional model can theoretically provide the global one with feedback, increasing overall accuracy, but this also increases the computing requirement substantially.
The second approach, statistical downscaling, takes advantage of statistical relationships between regional climate and global climate. That is, scientists may notice that when the global climate does A, the regional climate responds by doing B some percentage of the time.
By developing a long list of such statistical associations, scientists can input the conditions projected by global models into regional statistical downscaling systems to predict how the regional climates will respond to future global temperatures or greenhouse gas concentrations.
Tools: Models: Attribution Studies
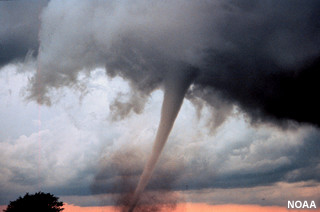
Is a particular weather eventsuch as a tornado outbreak or a record heat wavecaused by natural variability or global warming? There are no definitive answers yet, but scientists are beginning to provide insight into the effect climate change might have on the chances of an extreme event occurring.
Using computer models and sophisticated statistical techniques, researchers in the field of attribution science are able to estimate the odds that global warming increased (or decreased) the chances for certain extreme events.
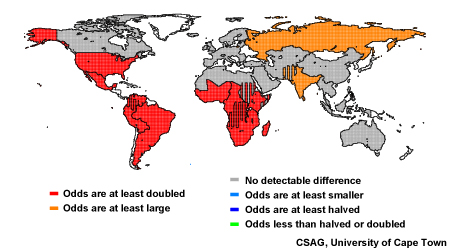
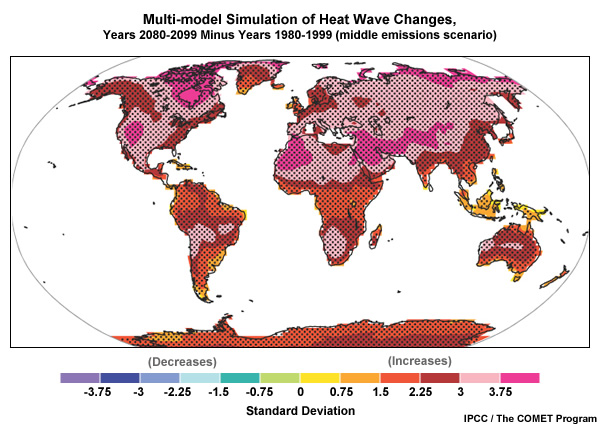
The science of attributing extreme water and weather events to climate variability and change is relatively new. Several recent case studies have shed light on unusual events such as the 2003 European heat wave and the 2010 Russian heat wave. And, as seen in this image, some scientists are even producing forecasts of the changes in the odds of occurrence for hotter, colder, wetter, and drier events.
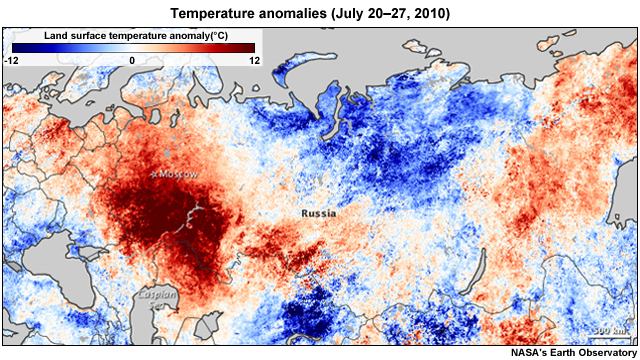
In the case of the 2010 Russian heat wave, researchers found the magnitude of that event was primarily caused by natural factors. Other scientists, who used a different approach, found that the risk of these types of events in western Russia has increased greatly due to global warming. It appears that, even if natural factors were the main cause of this particular weather extreme, the added strength produced by climate change pushed it to a new and dangerous level.
These early studies show promise, but much more work needs to be done to expand the regional areas and the types of weather events for which these studies are conducted. Researchers hope that improvements in attribution techniques will eventually lead to developing improved early warning capabilities.
Why Should We Care?
Only a Few Degrees?: Why It Matters
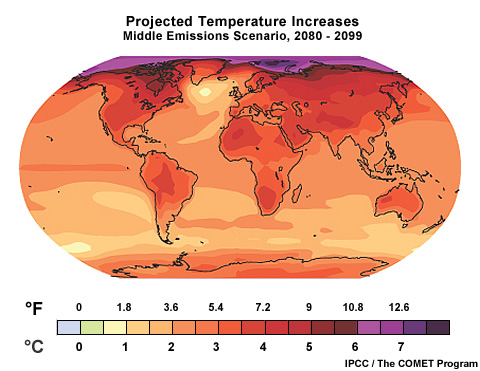
Global average temperatures are expected to increase by about 2-13°F (1-7°C) by the end of the century. That may not sound like a lot, so what's the big deal? The problem is that small changes in global average temperature can lead to really large changes in the environment.
Only a few degrees have made the difference between ice ages, temperate periods, and a hothouse Earth with green poles. During the last ice age, global average temperatures were only 7-13°F (4-7°C) colder, but ice ploughed as far south as Illinois. About 125,000 years ago, average temperatures were only a degree or so warmer than today, but sea levels eventually rose as much as 20 feet (6 meters).
Small changes in the global average temperature also mean heat waves get hotter and droughts get drier. This happens thanks to small changes in the way air and water circulate around the globe. The resulting modifications to the environment can have large consequences for ecosystems. For instance, during the wetter and cooler climate of the last ice age, the Great Basin of California was filled by a great lake ringed with pine forests. When the climate became warmer and drier at the ice age's end, the lake dropped 500 feet and lost 90% of its surface area. The pine forests became sagebrush desert. Such changes in precipitation could be just as important, or even more important, than temperature increases for many parts of Earth.
These kinds of effects are not temporary, either. The climate is like a large ship: once it starts turning, it is hard to stop. Whatever the new direction is, it will affect your children, your grandchildren, and many generations after.
What will a changing climate mean for us in the future? Scientists make the best assumptions they can using models to project what might happen. But we don't know for certain what will happen or when because we don't know what choices people will make about changing energy sources, limiting population growth, preserving forests, etc. Some impacts are more certain than others, some will occur sooner and others later, and some will affect developing nations more than wealthier ones.
Only a Few Degrees?: Weather in a Changing Environment
Climate and weather events now take place in a world that is different from the one our grandparents knew. The average temperature of the atmosphere is warmer. Oceans are also heating up, and polar ice is melting, as are many glaciers. Heavy bouts of rain and snow are becoming more frequent, with longer dry spells in between. Ecosystems are also changing. While day-to-day weather generally remains familiar, it plays out against a backdrop of change, and the mix of weather is slowly evolving as some events become more likely and others less common.
Extreme weather is a bit relative. For example, a hot day in Wyoming would be considered a mild one in Arizona. And we don't generally notice changes in climate because most weather falls within the range of what is expected. It is mainly the extreme events that get our attentionevents that are outside our normal experience and that often inflict human suffering. So how might global warming affect climate extremes and extreme weather? There are several possible ways. Let's look at temperature as one example.
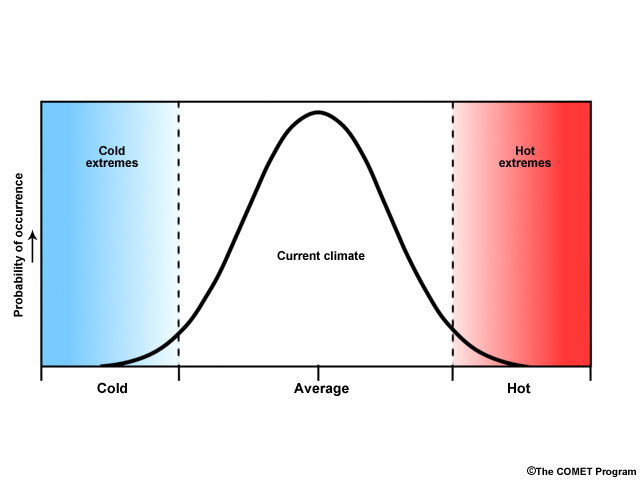
The normal distribution of temperature can be thought of as a bell-shaped curve like this, with the majority of the observations in the middle, but with rare events of extremely cold or extremely warm temperatures at the ends.
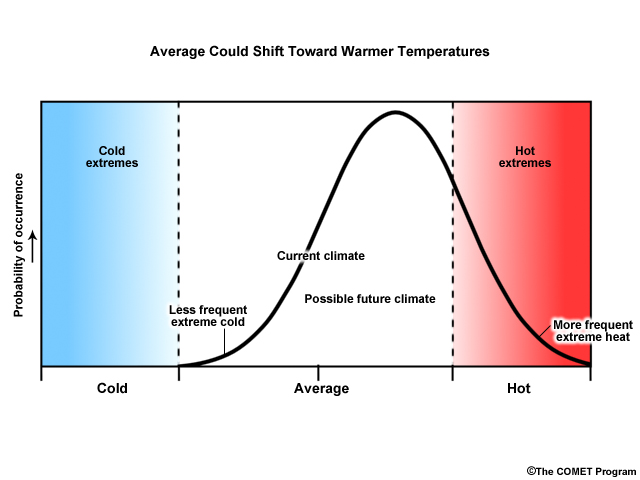
Global warming could shift the distribution to the rightdecreasing the frequency of very cold weather events, but greatly increasing the occurrences of hot weather.
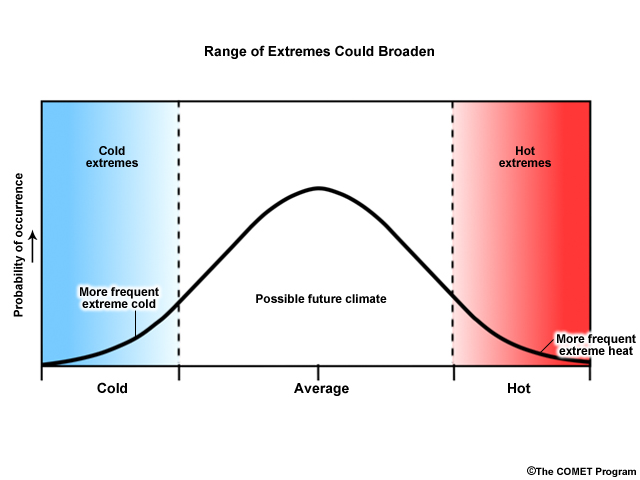
Another possibility is that climate change increases the variance in the distribution of temperaturein other words, it increases the range of possibilities at both ends of the distribution.
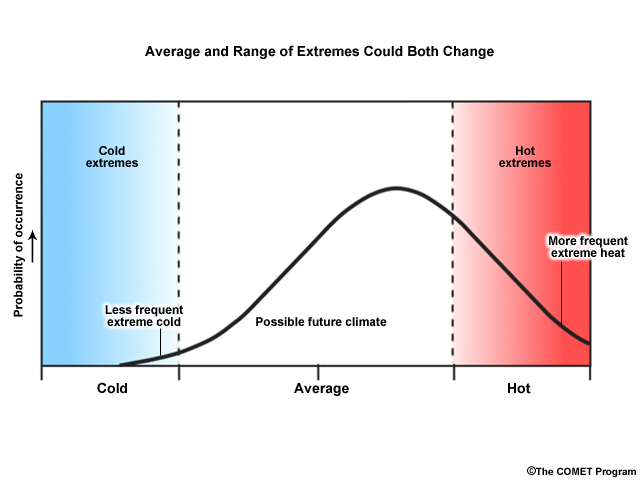
Or climate change could result in a combination of the two types of changes. We don't know exactly how the distribution of temperature will change, but most climate scientists strongly agree that, on the average, the global climate will continue to warm. However, the effects of this warming in specific locations are less known.
Only a Few Degrees?: Hotter Summers/Warmer Winters
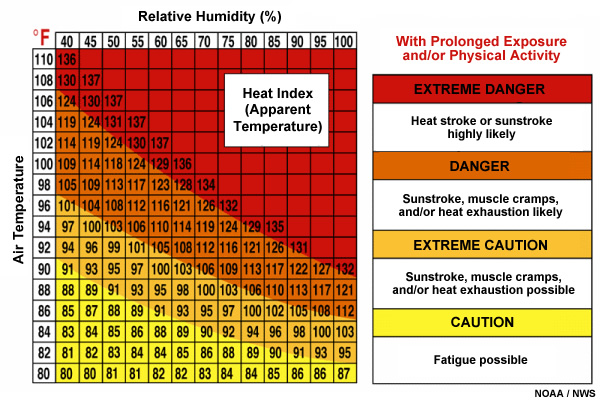
Of course, there will always be natural variability, with some places and some years warmer or cooler than average. In general, however, summers will get hotter, not only because of higher temperatures but also because humidities will increase, raising the heat index, which is a measure of the effects of heat plus humidity on humans. A warming trend on top of natural variability means that temperatures will cross today's heat thresholds more often.
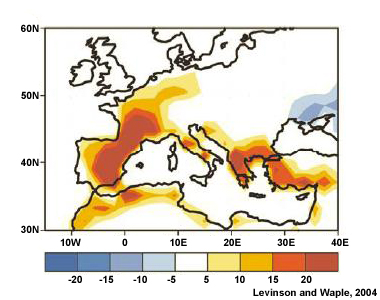
For example, the summer of 2003 was the warmest in at least the past 500 years in Europe and resulted in over 70,000 deaths. Researchers wanted to know if this heat wave was simply an extremely unusual natural event or whether climate change created an environment that altered the pattern of natural variability. Using a climate model, they analyzed the probabilities of exceeding the 2003 seasonal mean temperature under 2003 conditions, including the build-up of greenhouse gases from human activities. They then ran the model again without those greenhouse gases. Their conclusion is that global warming probably at least doubled the chances of the heat wave. Models predict that in many places, an extreme heat event that we see once every twenty years today will happen once every three years by the middle of this century, and even more frequently by century's end.
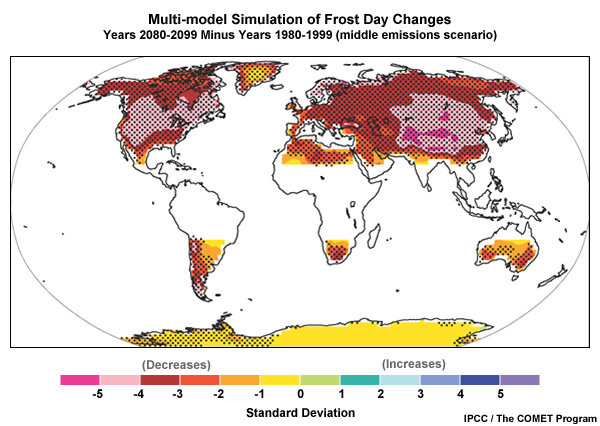
On the plus side, winters will be warmer in many places, reducing heating bills. And the number of days with frosts is likely to decrease. On the downside, it means more snow may fall as freezing rain, making ice more of a problem for motorists, pilots, and seniors.
Only a Few Degrees?: Droughts and Floods
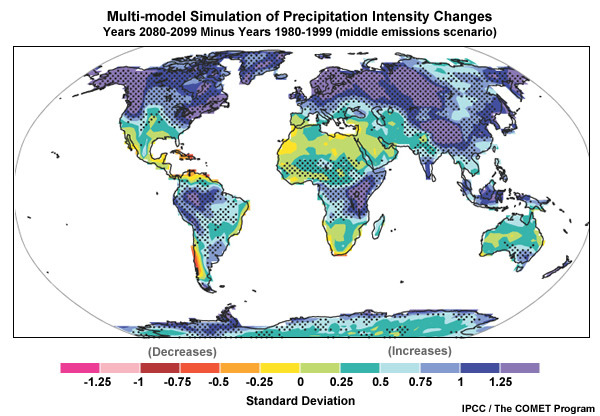
Because a warmer planet will boost evaporation and change atmospheric moisture circulation, many dry areas will become drier and wet areas wetter. In North America, on average, precipitation is likely to be less frequent but more intense when it does fall.
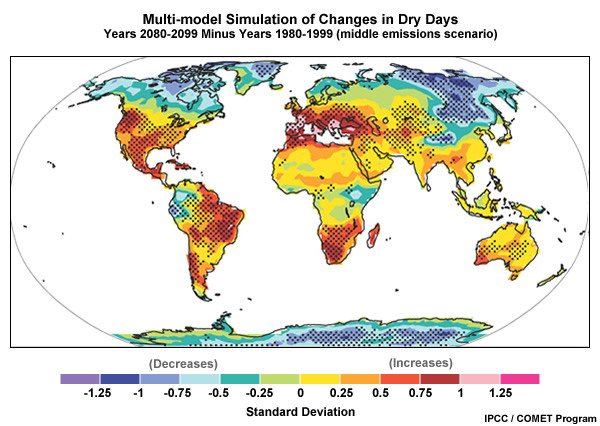
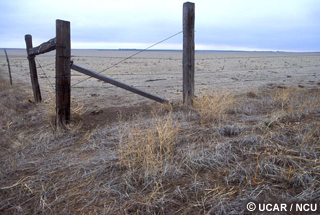
This may mean that the American Southwest becomes drier. Indeed, we have already begun to see these trends in the past few decades. And along with increased droughts comes an increased potential for wildfires.
Only a Few Degrees?: Sea-Level Rise
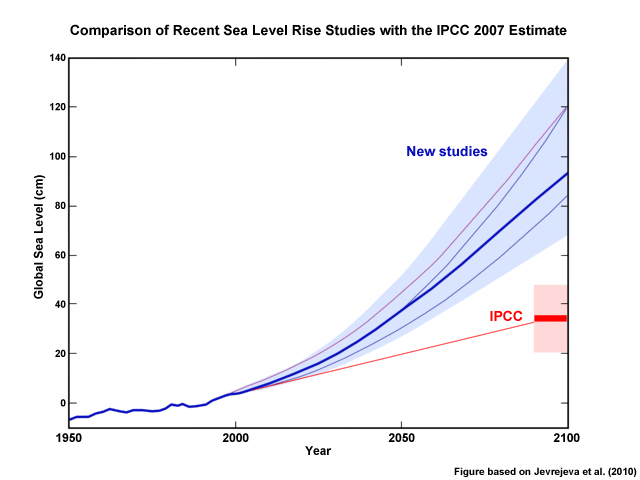
The oceans will continue their rise in the coming century. In their 2007 report, the IPCC estimated that the global average sea level will rise by about 9 to 20 in. (22-50 cm) by 2100 (relative to 1980-1999) under a range of greenhouse gas emissions scenarios. It is important to note that these estimates assumed that melting from Greenland and Antarctica would continue at the same rates as observed from 1993-2003. However, new research suggests that the IPCC predictions may be too low, and that sea level rise could be closer to 3 ft (1 m).
If seas rise two feet (0.6 meters), the United States could lose 10,000 square miles (26,000 square kilometers) of land surface, mostly on the Gulf and Atlantic coasts. If they rise three, they will inundate Miami and most of coastal Florida.
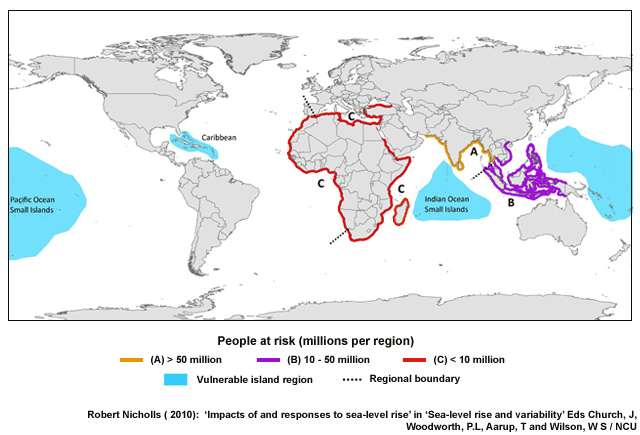
This map highlights regions that are most vulnerable to coastal flooding based on a scenario for the 2080s that assumes a global sea level rise estimate of 18 in. (45 cm). Nearly half of the world's population lives in low-lying coastal areas, and continued population growth along coasts increases vulnerability from sea-level rise, storm surge, and flooding.
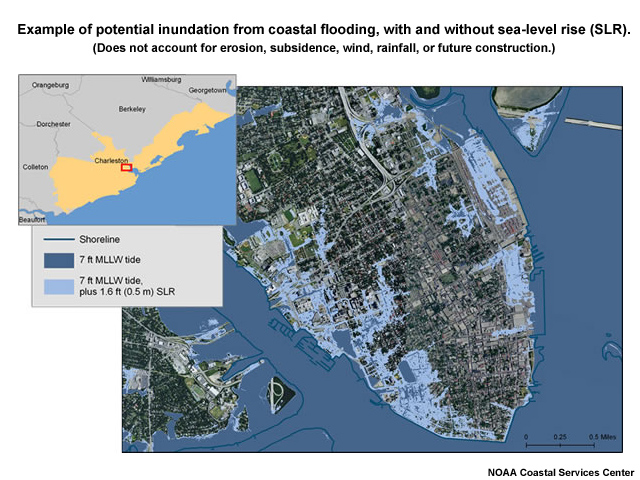
Even a small amount of sea level rise can produce major changes for coasts. In low-lying areas, a foot and a half of vertical rise (0.5 m) can cause inundation far inland, as illustrated in this image, which shows how Charleston, South Carolina would be impacted by that magnitude of sea level rise.
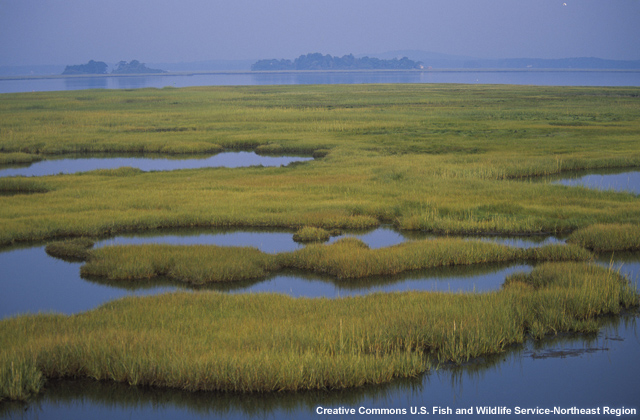
Other effects of sea level rise can include saltwater intrusion into freshwater aquifers that provide drinking water and loss of coastal wetlands and their ecosystems. One estimate projects 17-43% of U.S. wetlands could be submerged, of which more than half would be in Louisiana. Though new wetlands will form farther inland, their total area will probably be reduced, which would put New Orleans and other coastal cities at even greater risk from hurricane storm surge.
Only a Few Degrees?: Extreme Weather
Extreme weather events cover the spectrum from long-term droughts to short-lived tornadoes. When talking about the effect of climate change on different kinds of extremes, scientists have more confidence for some than others. But we do know that increasing greenhouse gas emissions are affecting temperature and precipitation patterns, which are the main drivers of weather events. So it makes sense that these changes can also alter the odds of an extreme event happening.
What Do You Think?
How do you think hurricanes are likely to be affected by global warming in the future?
a) More hurricanes
b) Fewer hurricanes
c) More intense (stronger wind speeds, heavier rain)
d) Less intense (lower wind speeds, less rain)
Answer: This actually is a subject of considerable scientific debate. Scientists are not sure whether the frequency of hurricanes will change, but they think that those that do form will likely be more intense with stronger wind speeds and heavier rain (answer c).
Studies suggest that for every 1.8°F (1°C) increase in tropical sea surface temperatures, core rainfall will increase by 6-18%, and surface wind speeds of the strongest hurricanes will increase 1-8%. Storm surge levels are also likely to increase. However, some studies suggest that vertical wind shear increases may reduce hurricane activity, at least in some areas.
We don't have enough data on tornadoes to determine whether their frequency or severity is changing. And global climate models can't currently simulate features as small as these storms.
While winters will be warmer overall, when storms do occur, they will likely produce more snowfall, stronger winds, and higher waves, although these effects may vary with location.

Of course, extreme weather events can have some positive effects. The warm winter of 2011-2012 in the U.S. resulted in lower heating bills, and many communities also saved by not needing snow removal services.
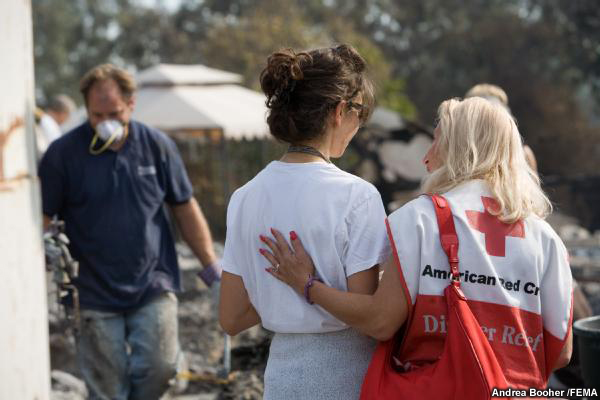
Often, it is an individual's or community's vulnerability to the adverse effects of extremes that largely determines whether a particular event is a disaster or not.
Other Effects: Ocean Ecosystems
As the oceans absorb more carbon dioxide, the chemistry of the ocean changes, putting many sea creatures at risk. The IPCC projects that by 2100 the pH of the ocean will drop to its lowest point in at least 20 million years. This means that tiny creatures at the bottom of the ocean's food chain will struggle to make their calcium-carbonate shells. Nearly every sea creature from plankton to whales would be directly or indirectly affected. If the ocean food chains collapse, many people in the world who depend on fish for food will go hungry, and seafood may become a delicacy that only the wealthy can afford.
Other Effects: Health
Here, too, the news is not good: people are already suffering from climate-related causes and more will be killed or sickened as the planet warms. Death rates spike an average of 6% during heat waves, so heat-induced deaths will probably rise sharply as temperatures increase and heat waves become more prolonged and intense. On the plus side, warmer winters could help reduce flu and other ailments.
As temperatures get milder, ticks, mosquitoes, rodents, and other carriers of disease will expand their range and sicken more people, particularly in developing countries. Here in the United States, dengue hemorrhagic fever, a tropical, mosquito-borne disease, hit for the first time in modern times in 2005 in the Lower Rio Grande Valley. Experts worry that dengue could become widespread in the U.S., and the reappearance of malaria is not out of the question either.
Air pollution will likely worsen, since higher temperatures and humidities will allow more ozone and particle pollution to form and linger longer. This will produce more asthma and deaths from heart and lung disease. One scientist at Stanford estimates there will be 1,000 additional air-pollution-related deaths per year for every 1.8°F (1°C) increase in temperature in the U.S.
More heavy downpours and floods will produce more diseases associated with flooding—like allergic reactions to mold and gastrointestinal disease outbreaks like cryptosporidium. Warmer ocean temperatures also favor the seafaring bacteria that cause cholera.
In the general irritation category, more carbon dioxide also helps plants like ragweed make more allergens and poison ivy make more of its irritating oil.
Other Effects: Economics
Most people will see climate change delivered to them in the form of higher water, energy, and insurance bills. Why? More droughts, higher temperatures, and more extreme weather will require lifestyle alterations ranging from what crops we grow to how we recreate. Climate change expands the range of conditions we need to prepare for, and that preparation costs.
Warmer temperatures will also mean less snow overall at certain latitudes because more will fall as rain, and the snow that does fall will melt faster. The consequences of this are plain to ski resort operators—a shorter, poorer ski season—but it also makes a difference to local water supplies. In some areas, snowpack will melt sooner and more suddenly (as it already is in most western states), and will flow uselessly past reservoirs that are still full during the winter. It also means rivers and streams will flow less during the later, hotter parts of summer. The difference this makes to farmers and ranchers is obvious, but it also affects people living in areas that depend on snow-fed reservoirs for water. There will likely be less water, and it will be more expensive.
On the other hand, the IPCC projects increases of 5-20% in crop yields in the first decades of this century. But with increased drought, flood, shrinking water supplies, and heat, farmers will have their hands full, and production in some regions could falter or fail. A 2008 report by the U.S. Department of Agriculture predicts grain and oilseed crops will likely grow faster, but the crops will be more prone to failure if climate variability increases and precipitation becomes less dependable. Additionally, invasive weeds tend to grow faster than most cash crops with higher CO2, and some herbicides will be less effective.
And ironically, with higher temperatures comes an increased potential for killing freezes. This is because plants start growing earlier, making them more vulnerable to sudden spring-time cold spells. The consequences of this will likely be felt in the produce aisles. An April 2007 frost that followed a week of warm weather caused more than $2 billion in agricultural losses in the central and southeastern U.S.
Other Effects: Security
Even national security is in the crosshairs of climate change. The U.S. military and intelligence communities have recognized climate change is a "threat multiplier." It increases competition for scarce resources, worsens conditions that cause governments to fail, and produces breeding grounds for extremism and terrorism.
"National Security and the Threat of Climate Change"
2007, CNA Corporation
"Climate Change and National Security"
2007, Council on Foreign Relations
"Global Climate Change: National Security Implications"
2008, U.S. Army War College
"National Intelligence Assessment on the National Security Implications of Global Climate Change to 2030"
2008, Deputy Director of National Intelligence for Analysis
Other Effects: Regional Impacts
Although the field of regional climate modeling is still maturing, it can take governments years to approve, fund, and implement adaption and mitigation measures. With no solid worldwide plans to reduce human emissions of greenhouse gases in the near future, many U.S. regions and states have begun to use the best information currently available from climate science as inputs for assessments of likely impacts and strategies for dealing with them.
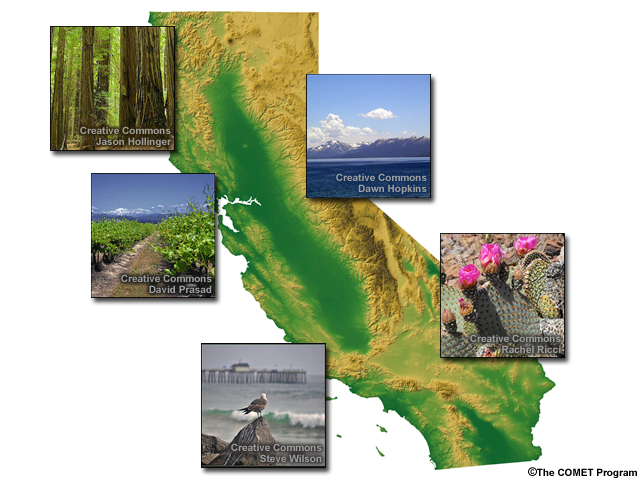
For example, the Second California Assessment (issued in 2011) used downscaled climate and sea-level rise scenarios from six global climate models run with two different greenhouse gas emissions scenarios. The models provided projections of warming, precipitation, and sea-level rise.
The model results were then given to experts from other fields who performed their own modeling and analyses to assess climate change impacts on various California sectors, such as water resources, agriculture, wildfires, public health, and energy. These experts also provided some guidance about possible strategies to reduce adverse impacts.
Of course, climate change impacts will vary from one location to another. Below are some of the more likely effects that U.S. regions can expect in the next century. All areas of the U.S. are expected to have higher summer temperatures, which can cause an Increase in heat-related illness and death, especially in urban areas. On the other hand, winter cold stresses will likely be reduced.
Northeast:
- Coastal erosion, loss of wetlands, and increased damage to roads and utilities from storm surges increased by sea-level rise
- Reduced winter recreation; increased summer recreation
- Increased ice storms
- Northward shifts in the ranges of plants and animals
- Air quality degradation
- More frequent severe flooding
- Lobster and cod fisheries reduced
Southeast and Gulf Coast:
- Increased coastal erosion, reductions in barrier islands and wetlands
- Increased coastal flooding from sea-level rise, storm surge, and heavy rain events
- Increased forest fires and insect outbreaks
- Decreased water availability
- Worsening storm surge impacts
- Major disruptions to ecosystems
Midwest and Great Lakes:
- Lower lake and rivers levels, affecting recreation, shipping, hydropower
- Reduced fish stocks due to warmer waters
- Worsening water quality as habitats are lost and undesirable organisms, such as algae, multiply
- Increased agricultural productivity
- Crop, livestock, and forest management practices must adapt to changes
Great Plains:
- Better farm yields in some areas
- Agricultural productivity shifts northward as drought potential increases
- Intensified spring floods
- Declining water resources
West:
- Possibly intensified winter precipitation
- Earlier snowmelt and reduced snowpack, reducing levels in some reservoirs
- Increasing competition for scarce water supplies
- Increased flooding
- Reduced winter activities
- Decreased yields of crops that are already near climate thresholds such as California wine grapes
- Less groundwater recharge
- Increased wildfire potential
Northwest:
- Forests stressed by droughts and high temperatures
- Increased coastal erosion and loss due to sea-level rise
Alaska:
- More pest outbreaks affecting forests; more wildfires
- General increase in plants and animals
- Less sea ice and warming adversely affects habitat for polar bears, marine mammals, and other wildlife, as well as commercial fishing
- Damage to infrastructure from melting permafrost
- Increased opportunities for summer activities
Hawaii:
- Likely sea level rise of 17-25 inches (43-64 centimeters) by 2100
- Possible large precipitation increases, depending on changes in El Niño
- Increased flooding from high surf and floods
- More frequent and intense droughts, with increases in forest fires
- Reduction in fresh water sources
- Potential adverse impacts to plants and animals in the cloud forests
How Sure Are Scientists?
IPCC Confidence/Probabilities: Signs, Effects, Causes
Though the greenhouse gas hypothesis has been thoroughly poked and prodded, no credible competing explanation has emerged that fits the bulk of the evidence. If greenhouse gases had remained unchanged, scientists found that solar and volcanic activity during the last half century should have produced cooling, not warming. Thus, the IPCC concluded it is "very likely", or greater than a 90% chance, that something other than natural causes is at work.
Here are the IPCC's confidence levels in other signs and effects of climate change, as well as for the evidence that humans are responsible.
IPCC Confidence in Signs of Climate Change |
||
| Signs | Certainty | % Probability |
| Warming of the climate system | Unequivocal | 100% |
| Less frequent cold days, cold nights, and frosts, more frequent hot days and hot nights over most land areas | Very likely | >90% |
| During the second half of the 20th century, highest average Northern Hemisphere temperatures in at least the past 1,300 years | Likely | >66% |
| Global area affected by drought has increased since the 1970s | Likely | >66% |
IPCC Confidence in Observed Effects of Climate Change |
||
| Effects | Confidence Level | Quantitative Confidence |
| Recent warming strongly affects terrestrial biological systems, including earlier spring events and poleward and upward shifts in plant and animal ranges | Very high | At least 9 out of 10 chance of being correct |
| Increases in number and sizes of glacial lakes | High | About 8 out of 10 chance of being correct |
| Increasing ground instability in mountain and other permafrost regions | High | About 8 out of 10 chance of being correct |
| Increased runoff and earlier spring peak discharge in many glacier and snow-fed rivers | High | About 8 out of 10 chance of being correct |
| Warming of lakes and rivers in many regions, with effects on thermal structure and water quality | High | About 8 out of 10 chance of being correct |
IPCC Confidence in Human Attribution |
||
| Evidence humans are responsible | Certainty | % Probability or Quantitative Confidence |
| Global average net effect of human activities since 1750 is warming | Very high confidence | At least 9 out of 10 chance of being correct |
| Solar + volcanic forcings have produced cooling in last 50 years | Likely | >66% |
| Most of observed increase in global average temperatures since mid-20th century due to increases in greenhouse gases from human activities | Very likely | >90% |
| Human-caused warming over last 30 years has a had a visible influence on many physical and biological systems | Likely | >66% |
IPCC Confidence/Probabilities: Confidence in Future Projections
Click to open the Surface Temperature Change Relative to 1870-1899 Baseline animation.
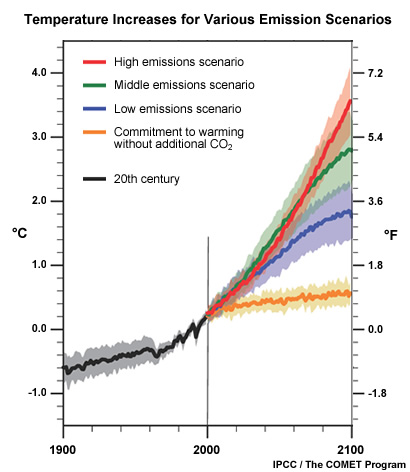
The IPCC found there is "high agreement" and "much evidence" that with current policies and practices, global greenhouse gas emissions will continue to grow over the next few decades. They also agreed that if we stopped burning fossil fuels today, the Earth would continue to warm due to long-lived gases and oceanic heat that are already in the system. So some amount of climate change and its impacts is inevitable.
| Scenario | Best Estimate | Likely range |
| Low emissions | 3.2°F (1.8°C) | 2.0-5.2°F (1.1-2.9°C) |
| Medium emission | 5.0°F (2.8°C) | 3.1-7.9°F (1.7-4.4°C) |
| High emissions | 7.2°F (4.0°C) | 4.3-11.5°F (2.4-6.4°C) |
The big unknown is how much and how soon we will reduce greenhouse emissions in the future. For the 2007 IPCC report, modelers looked at a number of scenarios that made various assumptions about fossil fuel use, economic growth, population, and technologies. Their estimates for temperature change by the end of the century are shown in the table and the previous animation.
IPCC Confidence/Probabilities: Confidence in Future Impacts
| Effect | IPCC Likelihood | % Probability, Confidence |
| 20-30% of plant and animal species become extinct if global average temperatures exceed 2.7-4.5°F (1.5-2.5°C) | Likely (extinction rate) Medium confidence temperatures will exceed 2.7-4.5°F (1.5-2.5°C) |
>66% 5 out of 10 chance |
| By 2080, millions experience floods due to sea-level rise | Very high confidence | At least 9 out of 10 chance |
| Frequency of warm spells and heat waves increases | Very Likely | >90% |
| Frequency of heavy precipitation increases | Very likely | >90% |
| Areas affected by drought increase | Likely | >66% |
| Intense tropical cyclone activity increases | Likely | >66% |
| Millions experience adverse health effects, especially in undeveloped countries | Likely | >66% |
Impacts from higher temperatures are difficult to evaluate, since they depend not only on how warm things get, but also on how fast humans adapt. This, in turn, depends on such things as national wealth and access to education and health care. This table describes impacts that the experts are reasonably confident about.
Two Positions: It's Not Happening
Although many statements that climate change is bogus are based on false or incomplete information, there have also been some legitimate scientific criticisms of climate change science. It's important to separate one from the other, particularly since misinformation can be stubbornly persistent, especially on the Internet. For example, you can find several websites and blogs where someone states that global warming is due to increased energy from the sun. However, observations of the sun for the past 30 years show no increase in its energy production.
The important questions posed by reputable climate scientists who disagree with most of their peers are these:
- Do we really know enough about the drivers of climate to be really sure that we know what causes change?
- Are scientists grossly underestimating the complexity of the Earth system?
- Are climate models good enough to accurately simulate the complex climate system?
- Are there processes that will limit warming naturally by producing a negative feedback?
These questions are important, and science thrives on debate that fuels further investigations. It is always possible that questions raised will lead to new information that will change our perspective. However, to date the majority of climate scientists are convinced that enough of the puzzle is visible to conclude that the world is warming and human activities are largely responsible.
Two Positions: It's Worse Than We Think
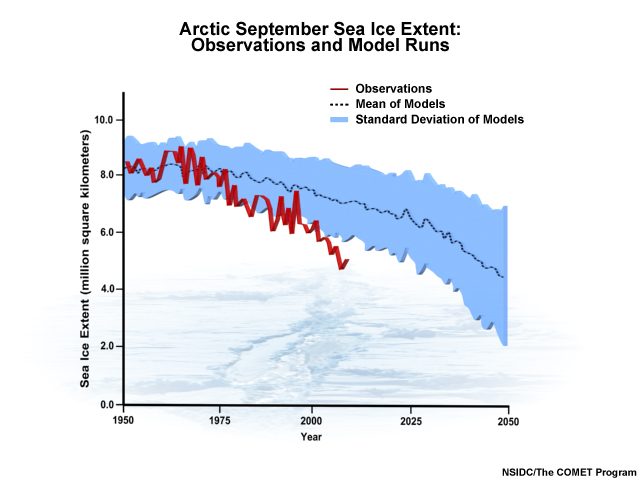
On the other hand, some climate scientists think IPCC has been far too conservative. They believe warming in the next century will be much greater than the IPCC assessments indicate, and there is some evidence to support this. For example, Arctic sea ice is melting much faster than scientists predicted. Also, actual fossil fuel emissions in recent years have exceeded all but the highest IPCC projections.
Since 2000, they have grown four times faster than in the 1990s. Some argue that the IPCC near-future assumptions about global energy use are too optimistic. A recent study also concludes that the IPCC estimates were too rosy with regard to how quickly developing countries will be able to afford technologies to reduce greenhouse gas emissions.
Scientists in this camp also say sea levels may rise far more than we anticipate because our calculations aren't taking into account the unexpectedly large melting and disintegration of the Greenland and Antarctic Ice Sheets. They also point out the last IPCC report was limited to already-published and peer-reviewed research, and the conclusions had to be reached by consensus. This is bound to produce a cautious, conservative estimate for the future, they say.
Two Positions: Consensus?
The IPCC is a very important process for determining consensus on climate change, but there are other ways to find out what scientists who know the most about climate really think. In 2007, the Statistical Assessment Service at George Mason University conducted a random survey of U.S. scientists who:
- Are members of either the American Meteorological Society (AMS) or the American Geophysical Union (AGU)
- Are listed in American Men and Women of Science, 23rd Ed.
- Live in the U.S.
- Have expertise and/or professional experience in the area of climate science
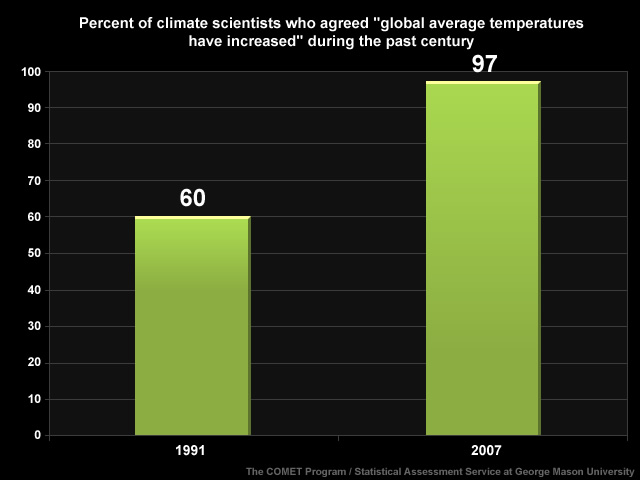
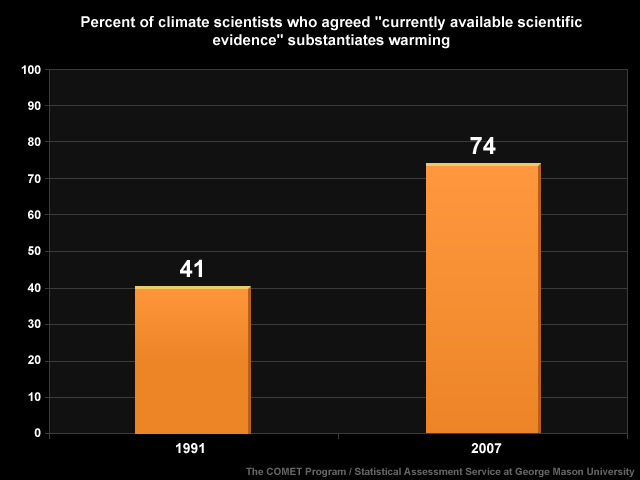
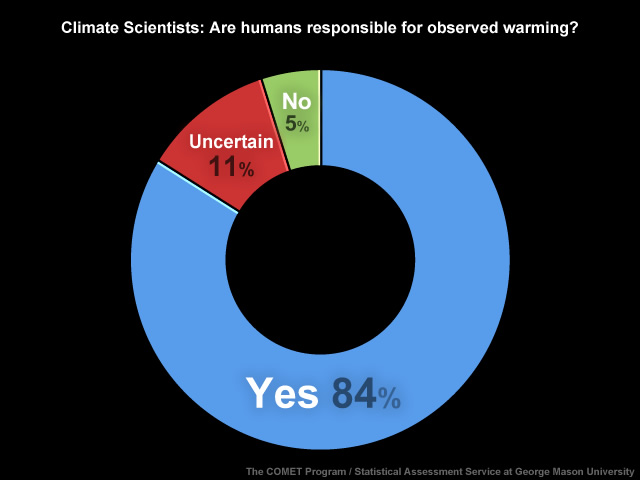
Ninety-seven percent of the 489 respondents agreed that "global average temperatures have increased" during the past century. That's up from 60% in 1991. Eighty-four percent said they personally believed human-induced warming is occurring, and 74% said "currently available scientific evidence" substantiates this, up from 41% in 1991. Only 5% said that human activity doesn't contribute to greenhouse warming, and 11% were uncertain. So the survey does indicate the bulk of climate scientists—those most knowledgeable about the field—now agree that human activity contributes to global warming.
As with all science that affects our lives, we need to be educated consumers. Do your homework, starting with the IPCC reports. All of the reports provide interesting information, although they are lengthy and quite technical. The AR4 Synthesis Report (www.ipcc.ch/pdf/assessment-report/ar4/syr/ar4_syr.pdf) is easy to read and provides a good summary of the other reports. Also look at the work from other authoritative sources such as the National Academy of Science (NAS), the American Meteorological Society (AMS), the American Geophysical Union (AGU), the American Association for the Advancement of Science (AAAS), the National Oceanic & Atmospheric Administration (NOAA), the Environmental Protection Agency (EPA), the National Aeronautics and Space Administration (NASA), etc..
When looking at information (particularly on the Internet) look at the source of the information—is it likely to be biased one way or the other? If so, look for alternative views from other sources and see what they say. Ask questions—if you read something that seems to contradict something else, then dig deeper. Trace the origins of the statement to the original source. Is it a peer-reviewed journal or something less exacting? What are the credentials of the author—is it a scientist with climate expertise?
What Next?
Strategies: Adaptation and Mitigation
Climate change may seem too large a problem to tackle, but it's a treatable problem. It won't be easy, and the longer we delay, the more difficult and expensive it will be.
There are two facets to combating climate change:
- Adaptation (adjusting to the changing conditions) and
- Mitigation (reducing greenhouse gases)
Adaptation includes strategies such as growing different crops that are suited to a different climate, building walls to hold back the rising seas, or moving people to safer locations. Adaptation is not optional because of the greenhouse gases already in the atmosphere. But there is still a choice. Will the adaptation be planned, or will it involve strife and large loss of life?
Reducing greenhouse gases—the mitigation part of addressing climate change—is necessary if we're going to limit the damage.
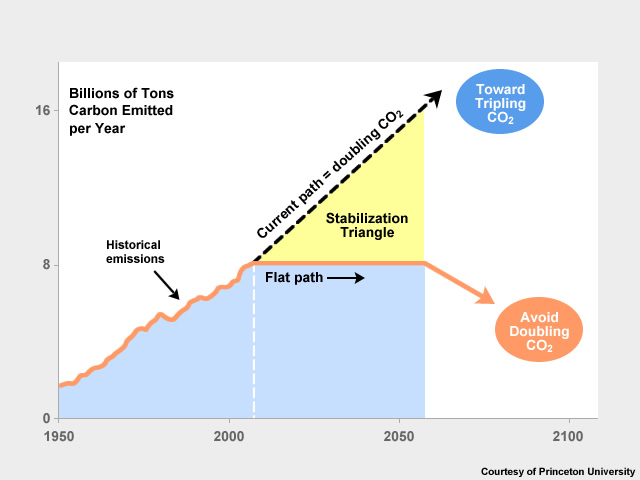
Here is the way one team of Princeton researchers sees it: Our current path is toward doubling CO2 emissions in the next 50 years, with even greater increases beyond that. In order to get off this path, we need to find ways to keep emissions constant for the next 50 years and then reduce them during the second half of the century. This would limit atmospheric CO2 to about 570 ppm—still greater than the roughly 380 ppm in the atmosphere today, but enough to avoid the worst predicted consequences.
In order to hold carbon emissions constant over the next 50 years, we need to find some combination of ways to cut 8 billion tons of carbon emissions per year. In the graph, the difference between where we are and where we'd like to be forms a triangle with a height of 8 billion tons in 2055. This triangle can be divided into 8 wedges representing one billion tons each.
What Do You Think?
Below are some technologies that could reduce one billion tons, or one wedge, of carbon. Some of these we could do right away, while others are based on technologies still being studied, such as capturing and storing carbon. Note also that this list represents only some of the possible strategies. However, the longer we wait to reduce emissions, the higher the target will need to be, and the more adaptation will be necessary. In 2004, when the wedges concept was first introduced, the target was only 7 billion tons.
Increased Efficiency & Conservation
• Efficient vehicles: Double car fuel efficiency in 2055 from 30 miles per gallon (mpg) to 60 mpg
A typical 30 mpg car driving 10,000 miles a year emits a ton of carbon annually. Projections are 2 billion passenger vehicles will be on the road by 2055. Doubling fuel efficiency would save a wedge of emissions. Car size and power could probably decrease in order to achieve this. Decarbonization of airline travel will likely prove more difficult, and aviation is the fastest growing component of transportation today.
• Reduced vehicle use: Halve the miles traveled by the world's cars in 2055
In order to achieve this wedge, society may have to invest in increased public transport and urban design changes. Because reducing vehicle use often means increased use of mass transit, which also emits carbon, some of the reduced emissions from this category may be double-counted.
• Efficient buildings: Cut emissions by 25% in all buildings
Significant emissions come from heating and generating electricity for buildings and industry. Two wedges are available in this category: one from residential and another from commercial buildings. In both the residential and commercial buildings, almost half of the savings are to be found in developing countries. The trend toward large houses and many appliances is a challenge to achieving this wedge.
• Efficient electricity production: Double the efficiency of coal-fired power plants
Today's coal-burning power plants produce about ¼ of the world's carbon emissions. The emission savings for this wedge come from converting the fuel to electricity more efficiently at the power plant. Utilities would have to spend more money to achieve this wedge, potentially raising prices for consumers.
Carbon Capture & Storage (CCS)
• CCS Electricity: Capture and store carbon from 800 large coal or 1600 large natural gas power plants
In CCS, the CO2 power plants normally release to the air would be captured and stored underground in geologic formations. The global storage capacity in oil and gas reservoirs is estimated at 10 to 20 wedges worth, but the method is currently experimental. Demonstration projects store about 1 million tons of carbon underground per year; it would take 3,000 similar projects to achieve one wedge. A main question is safety—small leaks from storage reservoirs would simply weaken the system, but a large leak could be deadly for any people or animals nearby.
• Capture CO2 at hydrogen plants: Increase hydrogen fuel production from coal by a factor of 10 and store the captured CO2
Hydrogen could be used as a substitute vehicle fuel. When it's burned, the product is water. But making the hydrogen from fossil fuels itself produces CO2. This CO2 can be captured and stored relatively efficiently at a central production plant, but new infrastructure would be needed to get the hydrogen from production facilities to small-scale users. Hydrogen is currently costly to produce, and there are safety issues associated with handling and storing it.
• Capture CO2 at coal-to-synfuels plant: Capture and store carbon from 180 coal-to-synfuels facilities
By mid-century, the world could be out of cheap oil and may turn to making synthetic fuel from coal. However, this process uses much more carbon than making fuel from crude oil. Carbon capture and storage could mitigate some of the emissions if carbon is captured and stored during the production process. However, carbon would still be emitted when the fuel is used by vehicles or buildings, so synfuels would only break even with emissions from gasoline and diesel. Achieving this wedge would require capturing emissions from 180 plants of the size of a synfuels plant in Secunda, South Africa, that produces 165,000 barrels of synfuel a day. As of 2008, this plant was the largest point source of atmospheric CO2 emissions in the world since it is not currently capturing and storing this gas.
Fuel Switching
• Nuclear electricity: Triple the world's current nuclear capacity
Nuclear power provides about 17% of the world's electricity and produces no CO2. One wedge would be saved if the current nuclear production tripled and replaced fossil fuel power plants. Perceptions about safety problems and waste storage issues make this a controversial energy source in the U.S.
• Natural gas electricity: Replace 1,400 large coal-fired power plants with natural gas plants
Because natural gas has a lower carbon content and natural gas plants are more efficient, switching to this fuel would result in about half the emissions of coal. Achieving this wedge would require generating about four times the global production from natural gas power plants operating in 2000. The availability and price of natural gas will be a challenge to achieving this wedge.
• Wind electricity: Increase wind-generating capacity 30 times
Wind energy currently makes up less than 1% of global electricity, but it is growing about 30% per year. An emissions wedge could be saved by displacing coal-based electricity through expanding current wind capacity by a factor of 30. This would require a combined area roughly the size of Germany, but the land can be used for other purposes such as crops or pasture. Difficulties include the availability of storage systems to compensate for the intermittency of the wind. Another limitation is the Not In My Back Yard phenomenon, in which people protest the siting of wind turbines nearby because they view them as an eyesore, a threat to property values, or a danger to creatures such as birds and bats.
• Solar electricity: Increase solar capacity 700 times
Photovoltaic solar cells can be expensive and can't collect energy at night. Solar panels also require significant surface area— a combined area of about the size of New Jersey to produce one wedge. However, the arrays could be located on both dedicated land or multiple-use surfaces such as building roofs and walls. This is one-fifteenth of the land required for a wedge from wind power, but land with only panels on it may or may not be reusable for other purposes as land with wind turbines is. Solar power currently provides less than 0.1% of global electricity.
• Wind hydrogen: Increase wind electricity 80 times and use it to generate hydrogen vehicle fuel
Wind power can produce hydrogen by splitting water molecules into hydrogen and oxygen. A wedge would require four million 1 megawatt wind turbines, which would take up significant land areas, though the land could also be used for farming or pasture. Hydrogen fuel can, however, be less safe to use and store than gasoline, and infrastructure for producing, delivering, and using the fuel would need to be created. As with wind power for electricity, finding acceptable locations for wind farms can be problematic.
Renewable Energy & Biostorage
• Biofuels: Increase biofuel production 30 times
Fuel made from plants still emits CO2, but the CO2 would have been released back to the atmosphere anyway as the plants decayed. Consequently, burning biofuels doesn't increase net atmospheric CO2 concentrations. Achieving a wedge would require the use of about one-sixth of the world's cropland, or an area about the size of India. This could potentially drive up food prices. If biofuel croplands are created by razing tropical forests, biodiversity suffers and carbon is released by the decaying or burned trees. Land resources could be stretched by using crop residues like husks and cobs for biofuel production, or by growing biofuel crops on lands that aren't suitable for food crops. Scientists are working on producing plants and algae that are super-efficient photosynthesizers, and thus require less land to produce the same amount of energy.
• Reduced deforestation, increased reforestation: Halve global deforestation and double forest planting in 50 years
Today there is a net removal of carbon from the atmosphere by forests and soils, even though deforestation adds between
1 and 2 billion tons of carbon to the atmosphere. Halting global deforestation would provide one wedge of emission savings,
but to achieve the same savings through reforestation would require new plantings over an area the size of the continental
U.S. Presently, about 40% of tropical deforestation is in Latin America, while 30% takes place in Africa and 30% in Asia.
In Latin America, forests are mainly cut to provide pasture for cattle; in Asia, cropland is number one; and in Africa
fuel wood and cropland share primary responsibility. Therefore, preserving forest reduces future land available for food
production.
• Conservation tillage: Apply carbon management strategies to all of the world's farm fields
Converting forest and grassland to cropland causes the loss of one-third to one-half of the carbon that had formerly been stored in the soil. This can be reversed by reducing the time the land is bare and by increasing cover crop planting. Conservation tillage, or less-invasive plowing techniques like no-till agriculture that reduce the aeration of the soil, are another effective approach. In fact, these practices can actually help the soil begin to store carbon, but the benefits are erased if the land is later deep-plowed.
Strategies: What You Can Do
As you can see, there are many ways society can approach the struggle to reduce carbon emissions, but there is no single solution. Many of the strategies mentioned are the realm of governments. And the ever-growing world population means that we'll have to work that much harder to reduce global emissions. But on an individual level, there are many things one can do to make a difference.
Future Work: Assessments and Research
The IPCC is not finished with its work. A Fifth Assessment Report is planned for 2013-2014. Climate models also continue to improve. Oceanographers, for example, want to incorporate massive ocean eddies in models. Other scientists want to better model rain and snow's effects on water supplies to help predict droughts and floods. And we need to learn more about what drives the giant ice sheets of the world, how much farther they are likely to melt or slide, and how that will affect sea level.
Scientists are also working on regional models that can predict the effects of climate change locally. That information could be used, for example, to decide whether to put funding toward more firefighters in the West or toward research on how open summertime waters in the Arctic will affect national security.
Scientists are working to produce better datasets from both surface observations and satellites. For example, we need to get a better handle on methane—from both ground and satellite measurements—to improve our understanding of its contribution to global warming. Ultimately, better data will help produce better model results, and many scientists are now working toward a "climate information system" that can tell us more precisely how, where, and why the climate is changing and help us decide how best to respond.
In short, the puzzle is already complete enough to know we need to take action, but climate scientists will continue working to improve the picture. These efforts will provide more pieces of the puzzle to help decision makers target adaptation and mitigation actions to preserve our future.