
Diagnosis
Once you have confidently identified a 50 dBZ Echo Top Height signature, this section will help you estimate the storm severity associated with it. Generally, the spatial and temporal scales of a signature are loosely related to the updraft strength. In other words, the larger and/or more long–lived the signature, the stronger the updraft that produced it. In velocity-based signatures, updraft severity can usually also be gauged by the magnitude of the measured radial velocities. Examining a storm’s overall temporal evolution will suggest whether the storm is becoming more or less severe. Radar signatures and associated storm developments can also be time-shifted relative to each other, as is the case in supercell tornadoes that occur during the collapse of the parent storm.
When comparing signatures to diagnose relative severity, keep in mind that it is assumed that signatures are sampled at equal ranges from the radar. Otherwise, a storm sampled at greater range (with a wider beam) can appear to be weak and/or weakening, while a storm sampled at a closer range (with a narrower beam) can appear to be strong and/or strengthening.
Degree of Severity
- Horizontal Extent – The larger the area of 50+ dBZ reflectivity values at the 2cm CAPPI level the more likley the presence of large hail.
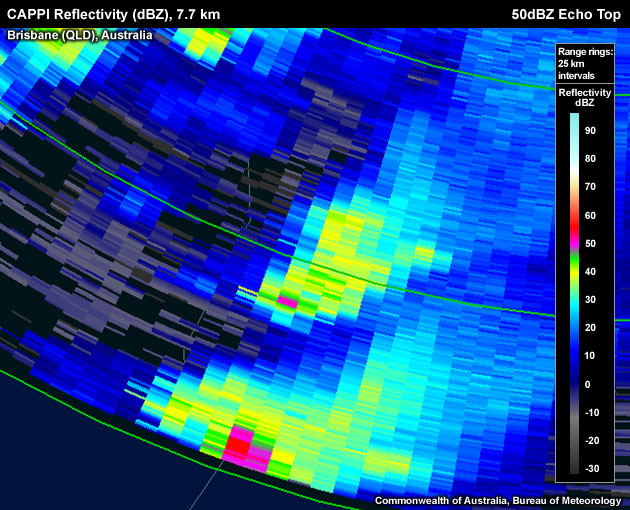
A few pixels with reflectivities greater than 50 dBZ breaking through the 2cm hail height on a CAPPI.
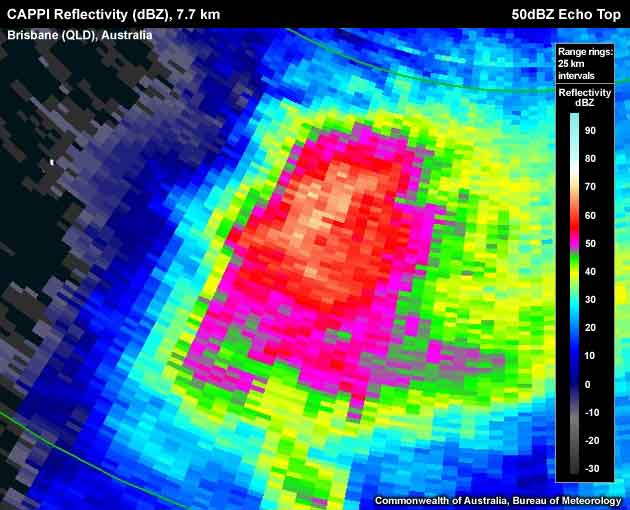
A large horizontal extent of very high reflectivities breaking through the 2cm hail height on a CAPPI. This second "CAPPI breakthrough" is far more meaningful in suggesting the storm's potential to produce large hail.
- Vertical Extent – The deeper the echoes greater than 50 dBZ above the freezing level, the more likely the reflectivities within the ideal hail growth layer are representing large hail.
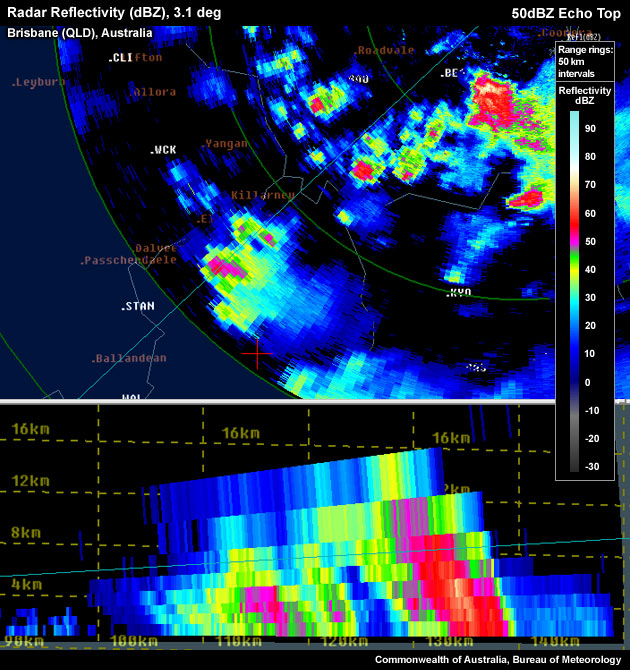
Short vertical depth of the 50+ dBZ echo (left) and a much taller 50+ dBZ echo which reaches approximatly 9 km (right).
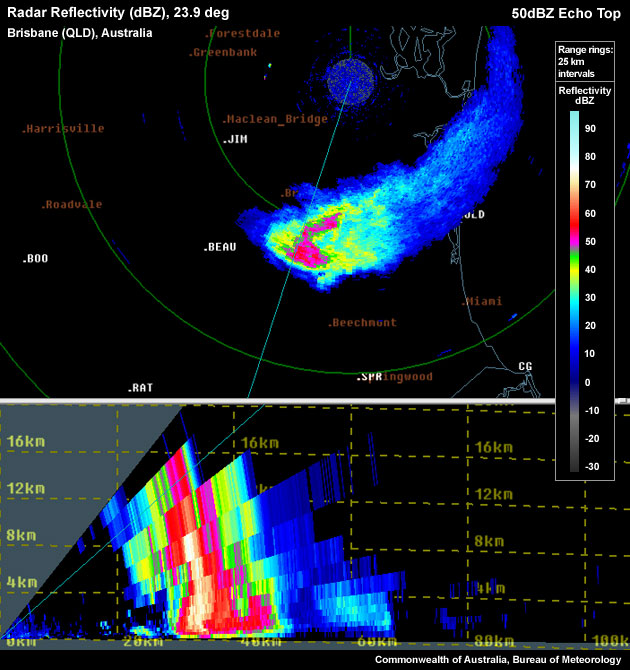
Tall vertical depth of 50 dBZ echoes. 50 dBZ echo top height reaches up to approximately 15 km.
- A different view of this is through the CAPPI window. The CAPPI doesnt have to be set to the 2 cm threshold in the 50 dBZ nomogram. To monitor for high–end severe thunderstorms, a CAPPI level could be set well above the hail growth layer, corresponding to the 4 cm or 6 cm hail thresholds on the 50 dBZ nomogram. This is especially useful as a monitoring tool, distinguishing the more severe storms from the rest.
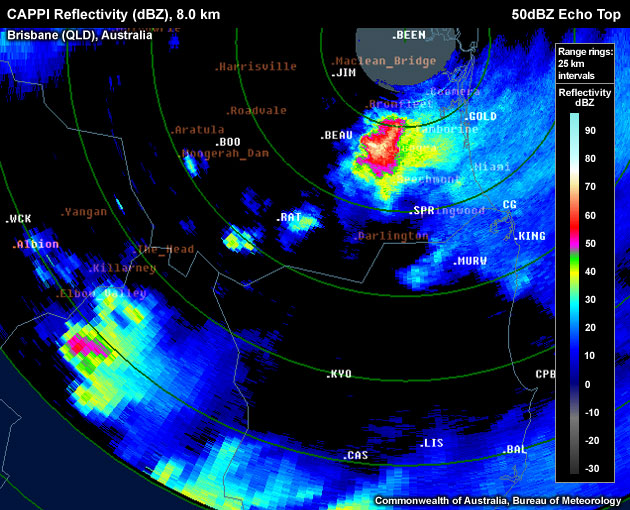
50 dBZ reflectivity breakthroughs at the 8km CAPPI level.
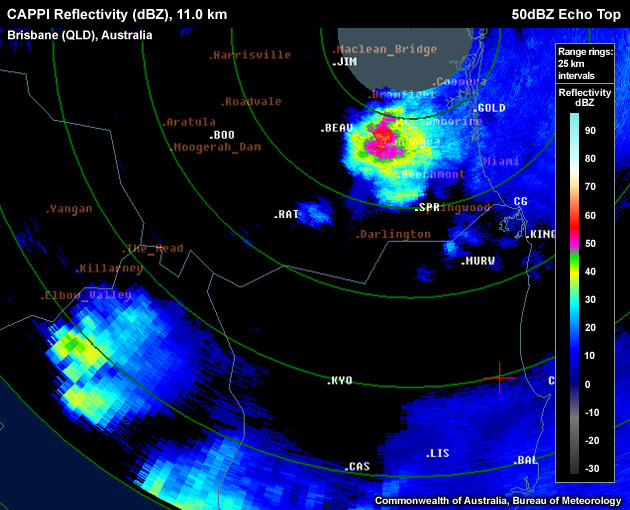
50 dBZ reflectivity breakthroughs at the 11km CAPPI level pointing towards the possibility of giant hail.
- Max dBZ – The higher the maximum dBZ value within the 2 cm hail CAPPI plane, the higher the probability that this storm is associated with large surface hail.
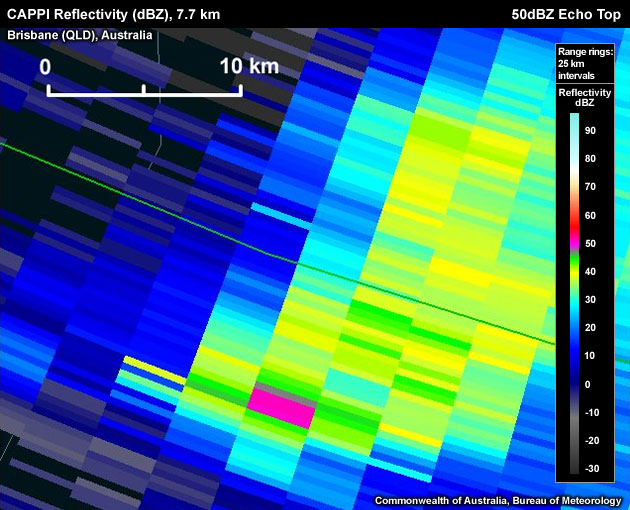
Maximum echo is approximately 50 dBZ
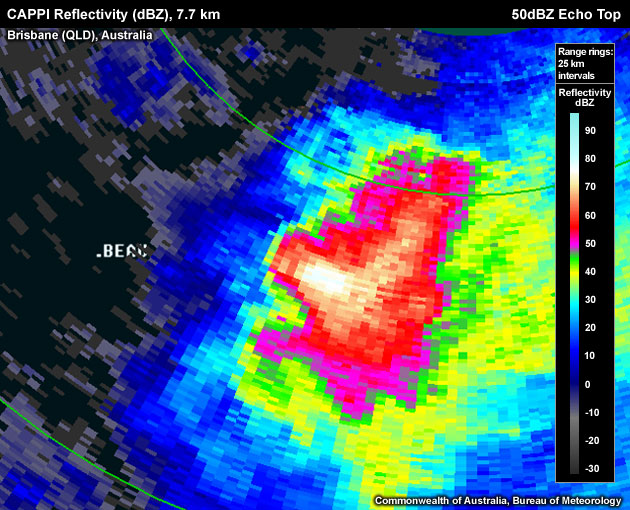
Maximum echo is approximately 77 dBZ
- Temporal extent – The longer the pixels with reflectivities greater than 50 dBZ "break through the CAPPI" level, the longer the potential residence times of hailstones within the ideal hail growth layer. This should increase forecaster confidence in the presence of large hail.
Loop of >50 dBZ echo "breaking through the CAPPI". Note the steady western storm persisting, whereas the eastern storm is much less steady.
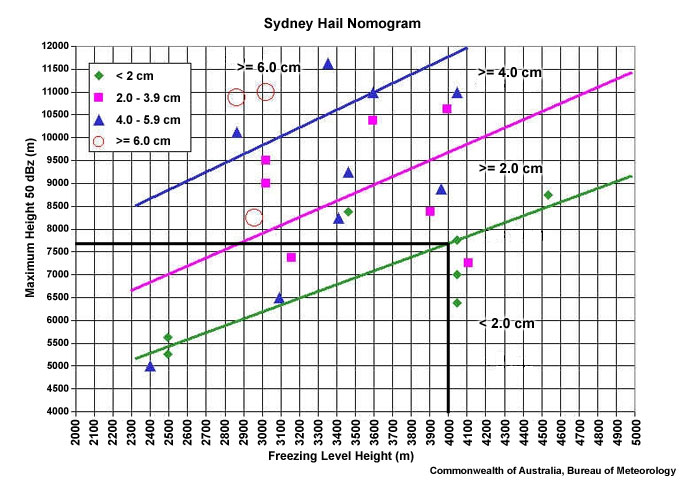
- Hail Size Estimation – alternatively, the 50 dBZ hail nomogram could be used in reverse to estimate an approximate size of the hail, using the height of the highest 50 dBZ echo. To use this technique, peform the following:
Reflectivity: PPI/Plan View
- Step up in elevation scans until you run out of >50 dBZ echoes.
- Step back down one elevation scan.
- Centre cursor over the > 50 dBZ pixel furthest away from the radar. Read off the height. Note: this can be done using the scale bar on the right of display, the info bar at the bottom of display or via the cursor data on the main control window.
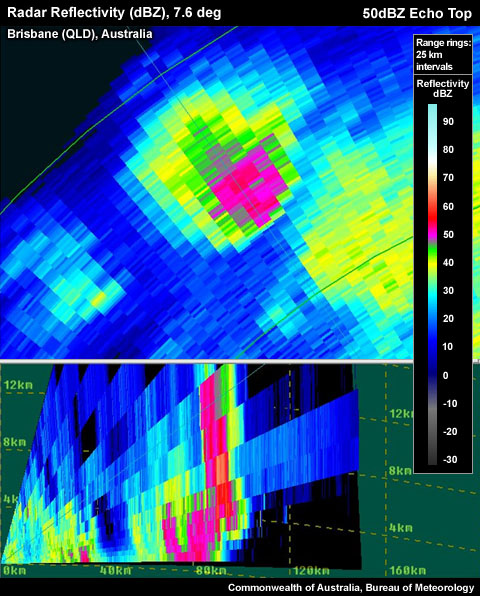
This thunderstorm displays 50+dBZ echoes extending to around 12 km, which (in just about any conceivable storm environment) is well past the hail growth layer.
- Equipped with the 50 dBZ echo top height of step 3 (e.g., 12 km), use the nomogram and the freezing level to read off the climatology-based estimate of the hail size. For this example the height is above the >6 cm hail threshold.
Considering all these aspects of the 50 dBZ echo top height signature will help determine overall whether you are dealing with a significant signature. Very tall 50 dBZ echo top heights (12 km or higher) would, in almost all cases, suggest a severe thunderstorm warning without additional corroborating evidence. However, radar information should never be used in isolation and should always be used in conjunction with observations from the near storm environment and any reports.
Most Likely Convective Hazards
If a thunderstorm has been determined to be severe and meets the required height for the production of large hail, the following convective hazards should be considered to be included in the severe thunderstorm warning:
- "Large hail" - with crude size estimates provided by the hail nomogram
- "Damaging winds" - likely due to the strong updraft that is required for large hail production, and therefore an associated strong downdraft
See Conceptual Models for more details on why particular severe weather should be included.