Diagnosis
Once you have confidently identified an anomalous storm motion signature, this section will help you estimate the storm severity associated with it. Generally, the spatial and temporal scales of a signature are loosely related to the updraft strength. In other words, the larger and/or more long–lived the signature, the stronger the updraft that produced it. In velocity-based signatures, updraft severity can usually also be gauged by the magnitude of the measured radial velocities. Examining a storms overall temporal evolution will suggest whether the storm is becoming more or less severe. Radar signatures and associated storm developments can also be time-shifted relative to each other, as is the case in supercell tornadoes that occur during the collapse of the parent storm.
When comparing signatures to diagnose relative severity, keep in mind that it is assumed that signatures are sampled at equal ranges from the radar. Otherwise, a storm sampled at greater range (with a wider beam) can appear to be weak and/or weakening, while a storm sampled at a closer range (with a narrower beam) can appear to be strong and/or strengthening.
Degree of Severity
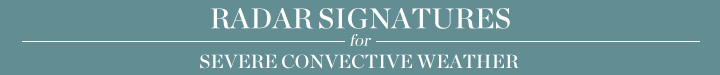
Anomalous storm motion can be an anomaly in speed, direction or both. The amount of deviation of the storm motion vector from the steering flow can indicate the severity of the storm. This can be explained through storm-relative helicity arguments. The shaded polygon in Example 1 is bounded by the tip of the storm motion vector and the hodograph itself between the surface and the top of the storm's inflow layer (often the 0-3 km layer). This area is a measure of the storm relative helicity (SRH) or alternatively the amount of useable "streamwise" vorticity that is ingested by the storm. Usually the more "off the hodograph" a storm moves, the more storm relative helicity the storm ingests through its low–level inflow. Therefore, the storms low-level rotational potential increases. The hodographs below illustrate these principles.
Here, a storm moves purely with the steering flow (red line and square shows the storm motion vector) and is associated with SRH (shaded area) of approximately –94 m2/s2
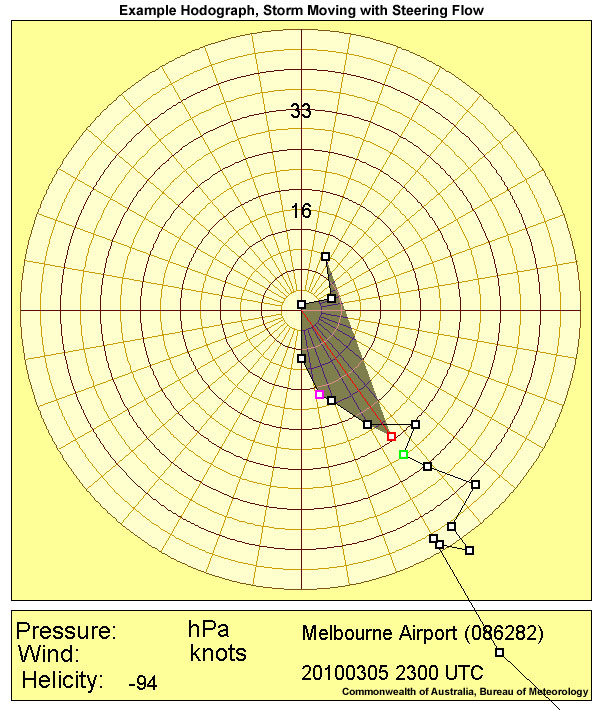
A storm (red box) is moving 16 kts faster than steering flow, resulting in a higher SRH (shaded area) of approximately –140 m2/s2
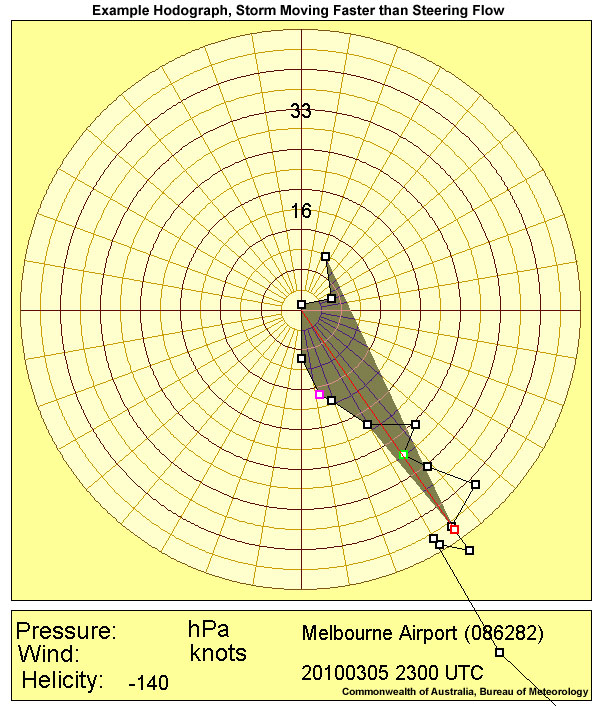
The most dramatic increase in SRH in the presence of a counter–clockwise curving hodograph is achieved for a left–moving storm, like the one given here, with a motion 16 kts to the left of steering and a SRH of approximately –222 m2/s2
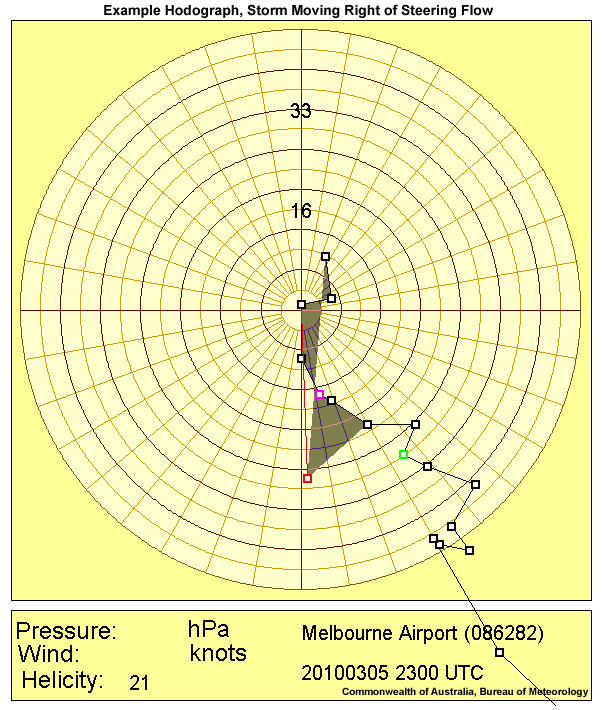
A right-moving storm in a counter-clockwise curving hodograph environment, might experience much lower SRH values, such as the storm above that is moving at 16 kts to the right of steering with a SRH of 21 m2/s2. Such a situation should increase its probability of demise, or at least a lower its potential for intensification. For a clockwise curving hodograph, conversely, a right-moving storm would experience the highest SRH values, and left-moving storms would be less likely to survive.
Bunkers et al. (2000) determined, after investigationg 290 supercell hodographs, that a correction vector added to the steering flow and which measures the amount that storms deviate from the 0–6 km mean wind (steering wind), ranges between 3 ms-1 to 16 ms-1. Therefore, based on these results, a deviation of ~7.5 ms-1 is used to estimate future supercell motion. In general, it is not clear why some supercells deviate significantly from the mean wind, while others do so to a much lesser degree. Reasons for the deviations from the mean winds by more than 10 ms-1 might be related to both the effects of the storm outflow and interactions of the storm and its cold pool with pre-existing atmospheric boundaries (Bunkers et. al., 2000).
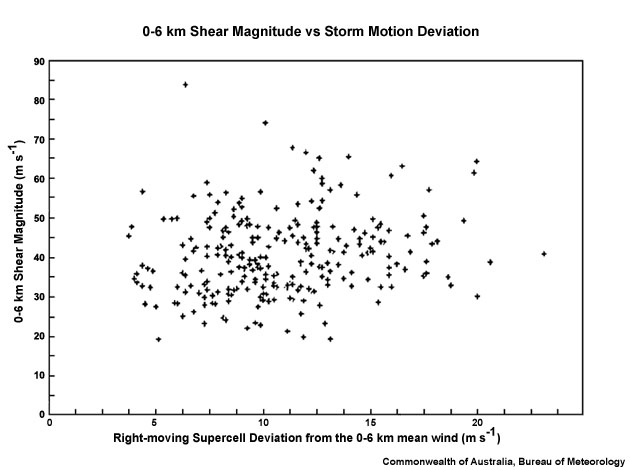
A US climatological study relating 0–6 km shear magnitude with the amount that right–moving supercells deviate from the steering flow (Bunkers, 2000).
Considering all these aspects of updraft/deep-layer shear interaction propagation will help determine whether you are dealing with a significant signature. Anomalous propagation is one of the few signatures that could influence you directly into issuing a severe thunderstorm warning, based on the tight connection to supercellular charactersitics via the helicity ingestation process. However, radar information should never be used in isolation and should always be used in conjunction with the near storm environment and any reports.
Most Likely Convective Hazards
If a thunderstorm has been determined to be severe and moves anomalously to steering flow, the following severe convective hazards should be considered for inclusion in the severe thunderstorm warning:
- Damaging winds – supercell
- Large hail – supercell
- Heavy rainfall resulting in flash flooding – supercell
- Tornadoes – due to supercellular classification, tornadoes are possible but additional consideration to the environment is required. Look for more evidence, such as strong 0 – 1 km shear and low Lifted Condensation Levels (LCLs).
See Conceptual Models for more details on why particular severe weather should be included.