
Diagnosis
Once you have confidently identified a Storm Top Divergence signature, this section will help you estimate the storm severity associated with it. Generally, the spatial and temporal scales of a signature are loosely related to the updraft strength. In other words, the larger and/or more long–lived the signature, the stronger the updraft that produced it. In velocity–based signatures, updraft severity can usually also be gauged by the magnitude of the measured radial velocities. Examining a storm's overall temporal evolution will suggest whether the storm is becoming more or less severe. Radar signatures and associated storm developments can also be time–shifted relative to each other, as is the case in supercell tornadoes that occur during the collapse of the parent storm.
When comparing signatures to diagnose relative severity, keep in mind that it is assumed that signatures are sampled at equal ranges from the radar. Otherwise, a storm sampled at greater range (with a wider beam) can appear to be weak and/or weakening, while a storm sampled at a closer range (with a narrower beam) can appear to be strong and/or strengthening.
Degree of Severity
The stronger the maximum radial velocity difference, ΔV, is over the divergent area, the stronger the associated updraft velocity that is required to maintain the divergence. The following nomogram was produced from a study conducted in the United States by Witt and Nelson in 1991, correlating observed hail size to the magnitude of the storm top divergence.
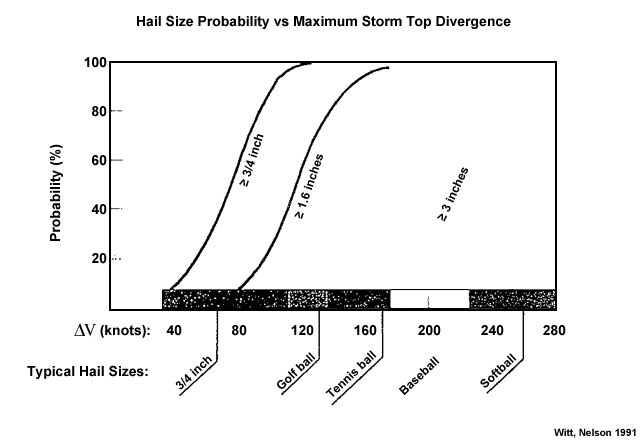
Probability of occurrence of various hail sizes based on the radial velocity differential across the storm top divergent flow DV.
To use the nomogram, perform the following:
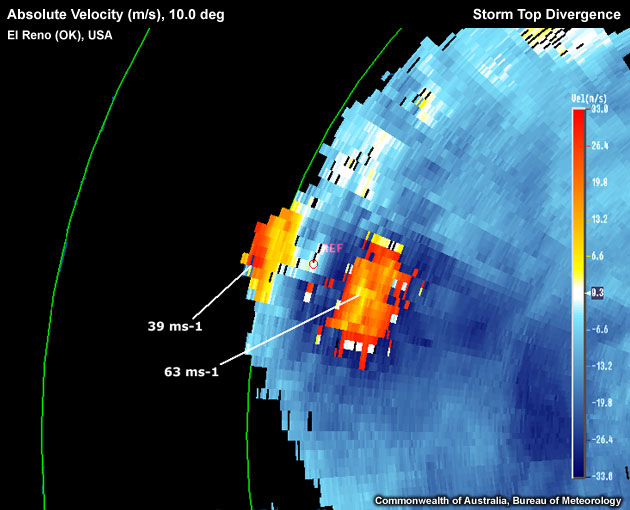
Example radial velocity difference calculation. Maximum inbound wind is aliased to yellow. Maximum outbound wind is aliased to dark blue. Radar Nyquist velocity is 36 m/s (70 knots). Thus, the corrected maximum winds within the signature are 63 m/s inbound and 39 m/s outbound.
- Find the area of divergence
- Read off the maximum inbound and outbound velocity values and correct both for possible aliasing
- Add the magnitudes of these two values together and use this number to find the corresponding probabilistic estimate of the maximum hail size on the nomogram. For the example above: ΔV = (39 + |–63| ) ms-1 = 102 ms-1 (198 knots).
The figures presented enables you to gauge whether you are dealing with a significant signature. Strong storm top divergence (ΔV exceeding approximately 50 knots) strongly suggests the presence of a severe thunderstorm. However, radar information should never be used in isolation and should always be considered in conjunction with information about the near storm environment and any spotter reports.
Most Likely Convective Hazards
If a thunderstorm has been determined to be severe and possesses a strong Storm Top Divergence signature, the following severe convective hazards should be considered for inclusion in the severe thunderstorm warning:
- Damaging winds – a strong updraft, with potential to produce a strong downdraft.
- Large hail – a strong updraft has the potential to produce large hail, providing the updraft extends into the hail growth layer, –10°C to –30°C. Also the nomogram should give some direct indication of the maximum hail size expected from the storm.
See Conceptual Models for more details on why particular severe weather should be included.