«- back to print version table of contents
Low-level Convergence
Detection
Strong low–level convergence below a storm's updraft can be an indicator of an intensifying or strong updraft. Identifying convergence is best done using radial velocity data from a Doppler radar. Convergence requires winds to approach one another along a radial and should be collocated with the updraft.
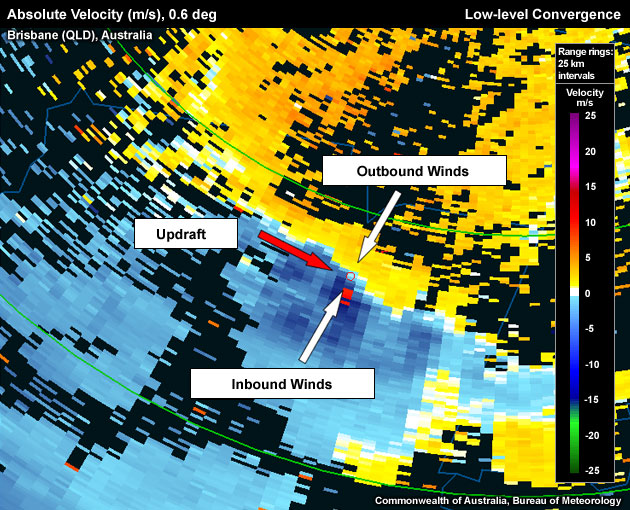
Low level convergence associated with an updraft (updraft location is marked by a red hollow circle). Maximum inbound velocity is aliased (red pixels).
To determine if the signature you are seeing is an updrfat tied to low-level convergence, use the following criteria:
Reflectivity: PPI/Plan View
- Step up in elevation scans until you run out of >50 dBZ echoes
- Step down one elevation scan.
- Centre cursor on the upshear side of the >50 dBZ core (this is to account for storm movement during the time interval between the lowest and the storm top tilt, especially in strong winds aloft).
- Set a reference point.
- Step down to the lowest elevation scan.
- Switch to velocity data.
Velocity: PPI/Plan View
Is the reference point found in the previous step collocated with velocity convergence (i.e. the zero isodop line with inbound radial velocities downrange and outbound ones uprange)? If yes, a Low–level Convergence signature is present.
Potential Difficulties in Detection
- As only two–dimensional velocity data is displayed on any PPI image, an apparent convergence signature may only be indicative of confluence associated with weak upward motion.
- Aliasing Folded or strong velocity values, especially in strong background flow or on C–band radars with lower Nyquist velocities, may be difficult to recognise
- Viewing angle If convergence sets up such that the converging winds point across, or normal to, the radial, the convergence signature won't show up in Doppler velocity data.
- Strong unidirectional background flow – If using ground–relative velocity data, a convergence signature may appear only as a decrease in velocity rather than a change in sign
- Radar sampling – "Noisy" velocity data may be present, usually due to dual PRT algorithm unfolding errors on Australian radars.
Examples of Low-level Converegence
Low–level convergence associated with an updraft (updraft marked by a red hollow circle). The maximum inbound velocity is aliased (red pixels).
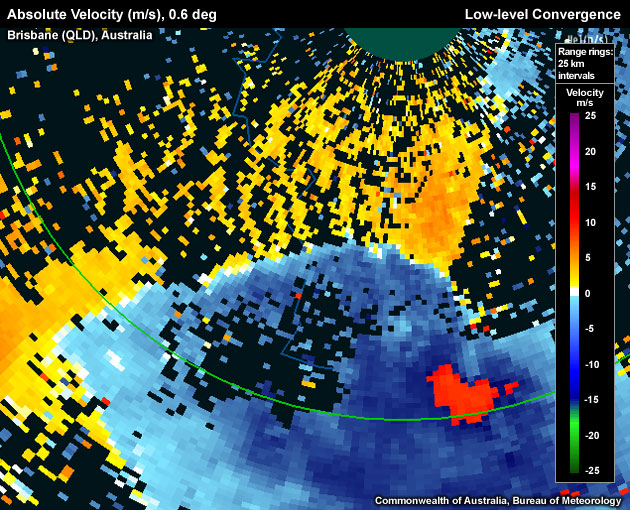
Low–level convergence along a surging gust front from a storm to the south of the boundary. Gust fronts such as this one often initiate new deep convection.
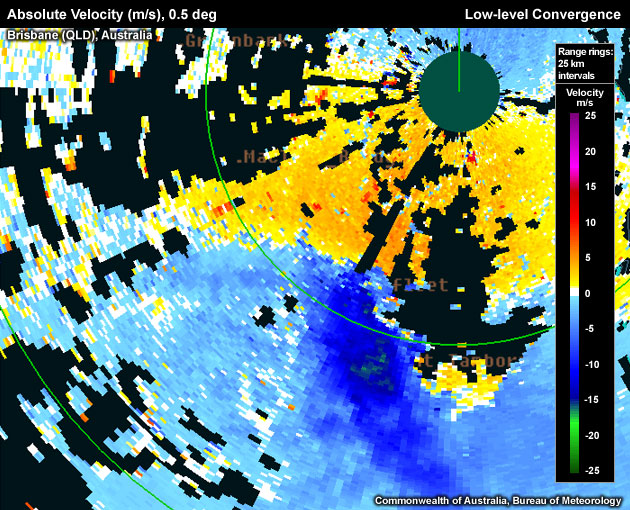
Low–level convergence along a gust front from a storm to the south of the boundary.
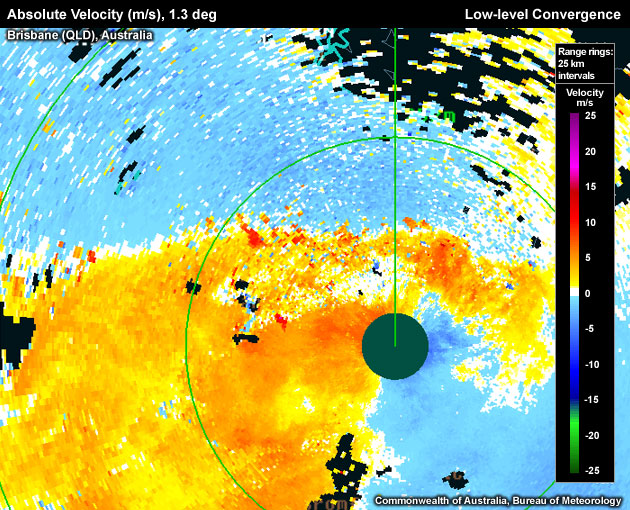
Low–level Convergence signature marking a northward–moving cold front north of the radar location. Storms that manage to keep pace with the northward movement of the convergent boundary would increase their chances of development.
Low-level Convergence Look–a–Likes
- Signature not collocated with updraft - You might be detecting convergence, but not convergence feeding into an updraft of a thunderstorm.
- Aliasing Not recognising aliased data can give the impression of convergence, but merely indicates unidirectional flow that is increasing in strength past the radar's Nyquist velocity.
Conceptual Model
A strong Low–level Convergence signature below a storms updraft can be used as one of many signatures that suggests that the associated updraft is likely to intensity or is already strong. The reason for this interpretation is that convergence below an updraft naturally enhances the low–level mass flux into the updraft, supplying it with water vapour and energy.
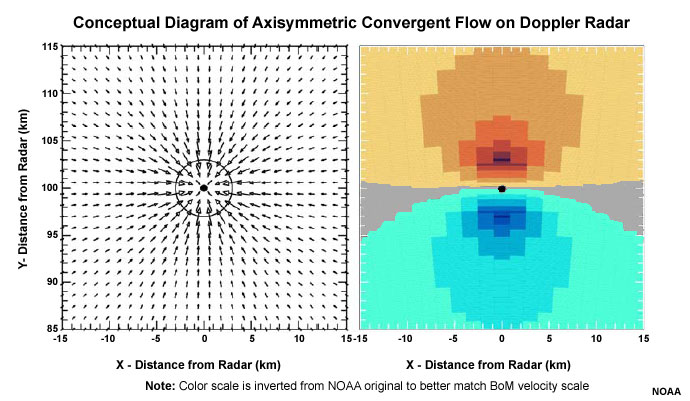
Doppler velocity pattern (right) corresponding to axisymmetric convergent flow (left). The maximum radial velocity of 25 m s-1 (49 kt) is at a core radius of 3 km (1.6 n mi); the radius of maximum winds is indicated by the circle. Black dot represents the center of the flow. Arrow length is proportional to wind speed. Negative (positive) Doppler velocities represent flow toward(away from) the radar.
Determining Thunderstorm Classification
Low–level Convergence signatures could be found associated with all storm types listed here.
To help determine the classification of the thunderstorm you are observing, use the following flow chart to help diagnose which thunderstorm conceptual model you should consider more closely
Diagnosis
Once you have confidently identified a Low–level Convergence signature, this section will help you estimate the storm severity associated with it. Generally, the spatial and temporal scales of a signature are loosely related to the updraft strength. In other words, the larger and/or more long–lived the signature, the stronger the updraft that produced it. In velocity–based signatures, updraft severity can usually also be gauged by the magnitude of the measured radial velocities. Examining a storms overall temporal evolution will suggest whether the storm is becoming more or less severe. Radar signatures and associated storm developments can also be time–shifted relative to each other, as is the case in supercell tornadoes that occur during the collapse of the parent storm.
When comparing signatures to diagnose relative severity, keep in mind that it is assumed that signatures are sampled at equal ranges from the radar. Otherwise, a storm sampled at greater range (with a wider beam) can appear to be weak and/or weakening, while a storm sampled at a closer range (with a narrower beam) can appear to be strong and/or strengthening.
Degree of Severity
The following spatiotemporal attributes of a Low–level Convergence signature are linked to the strength of a collocated updraft:
- Strength of the convergence – the stronger convergence, the larger the mass flux in the updraft base, therefore the stronger the updraft is likely to be.
- Residence time of an updraft within the convergence zone – the longer the updraft resides within the low level convergence, the longer the updraft is being supplied with warm moist boundary layer air, which in turn should increase or at least support the updrafts strength. This is especially applicable in moderate to strong deep layer shear environments where storms can be longer–lived.
- Depth of the convergence – the deeper the convergence zone below an updraft, the more protected the moist, warm boundary parcels are from entrainment of drier environmental air aloft on their way to the level of free convection (LFC). Deeper convergence zones more effectively prevent the reduction of surface parcel CAPE values whilst parcels rise into and through the updraft (Ziegler et al., 1997).
Considering these aspects of the low–level convergence will help to determine overall whether you are dealing with a significant convergence signature. For a severe thunderstorm warning consideration, even a significant Low-level Convergence signature still requires additional evidence for storm severity from other signatures and should always be considered in conjunction with the near storm environment and any spotter reports.
Most Likely Convective Hazards
If a thunderstorm has been determined to be severe and possesses a Low–level Convergence signature of significance, the following severe weather should be considered to be included in the severe thunderstorm warning:
- damaging winds a strong updraft, with potential to produce a strong downdraft.
- large hail a strong updraft has the potential to produce large hail, providing the updraft extends into the hail growth layer, –10°C to –30°C.
Note that the Low–level Convergence signature below an updraft merely allows the conclusion that an updraft is likely to intensify, or at least maintain its current intensity. The hazards listed above, common with any severe convective storm, should be seen in the light of a continuing threat, rather than a tight link between the convergence signature and this particular hazard. See Conceptual Models for more details on why particular severe weather should be included.
References/Addendum
Ziegler, C. L., T. J. Lee, and R. A. Pielke Sr., 1997: Convective initiation at the dryline: A modeling study. Mon. Wea. Rev., 125:10011026.