«- back to print version table of contents
Damaging Low-level Winds
Detection
Damaging Low-level Winds is the only signature that directly observes one of the four convective hazards through radar eyes. The definition of severe damaging surface winds in Australia is gusts exceeding 48 knots at 10 m AGL. Winds that close to ground level are difficult to meaningfully estimate by radar unless the storm is very close to the radar.
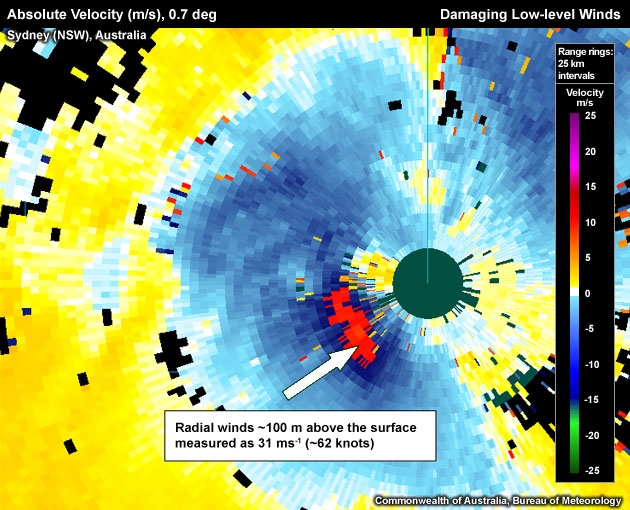
Measurement of radial winds past the severity threshold of 48 knots with the radar beam centre at approximately 100 metres above radar level.
Velocity: PPI/Plan View
- Using one of the lowest velocity tilts through a thunderstorm (particularly, pay attention to those storms that are tall, large or have intense cores), move your cursor over the individual pixels, then note the maximum radial velocity recorded. Note: Be wary of aliased data. Aliased data is common with this signature due to the strength of the wind required.
- Are there any (dealiased) velocity pixels exceeding 48 knots? To do this read the velocity off the scale bar, the info bar or the cursor data window.
- Is the damaging wind measurement obtained in (2) located close to the surface (within, say, a few hundred metres)? To determine this, read the height of the pixel off the scale bar, info bar or the cursor data window. If yes, low-level damaging winds are observed.
It is unlikely that the radial velocity observed in the Doppler channel equals the total surface wind. Three main adjustments are required to deduce the likelihood of damaging winds at the surface:
- Viewing angle: The Doppler velocity shows only the radial component of the total wind. Due to this, the Doppler velocity is most likely an underestimation of the true wind velocity, and adjustments for the viewing angle need to be made.
- Observation height: The radial velocity observed along the radar beam is most likely an overestimation of the true radial wind at the surface given that the total wind generally increases with height due to the decreasing influence of surface friction with height. The stability of the atmosphere would have the greatest impact on the shape of the velocity wind profile. The lower the stability of the atmosphere, the more vigorous the eddies, and therefore the stronger the transfer of vertical momentum. There are, of course, exceptions to the rule that wind speeds should increase with height. In microbursts the strongest horizontal winds can be very close to the ground.
- Radar sampling: The observed radial velocity on the radar display is an average of individual measurements throughout a broader pulse volume. Wind gusts can occur on a scale smaller than the pulse volume and would therefore be averaged with individual wind measurements that are less strong. This averaging process overall means that the radar measurement is an underestimate of the strongest winds within a pulse volume.
In summary, radar yields pulse-averaged radial velocities (a double underestimate of the total velocity) above the surface (mostly an overestimate of the total surface velocity). Ideally, forecasters should endeavour to apply a viewing angle, pulse averaging and a height correction to estimate the total surface winds from the observed radar velocities at the lowest scanning angles.
There are a number of signatures that could be used as precursor to the onset and detection of damaging winds. Any of the signatures suggesting the presence of a strong updraft, could be used as an alert to the potential of a strong downdraft and damaging winds. For microbursts, the presence of strong low-level divergence signature could be a very short lead time precursor to the onset of damaging winds. Also for microbursts, midlevel convergence near a descending precipitation core (a.k.a. a Mid-Altitude Radial Convergence or MARC signature) might herald a microburst formation (not shown).
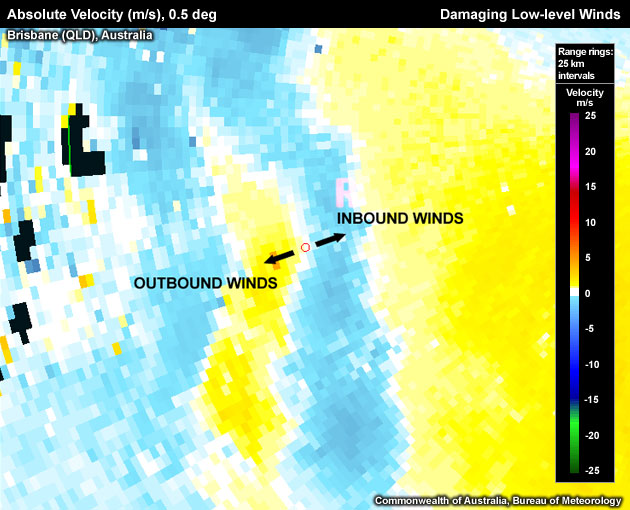
Low-level divergence signature, a potential precursor for damaging winds at the surface for the special case of microbursts.
Potential Difficulties in Detection
- Aliasing – Forecasters may either not detect the signature, or are unable to determine the actual radial velocity due to velocity aliasing.
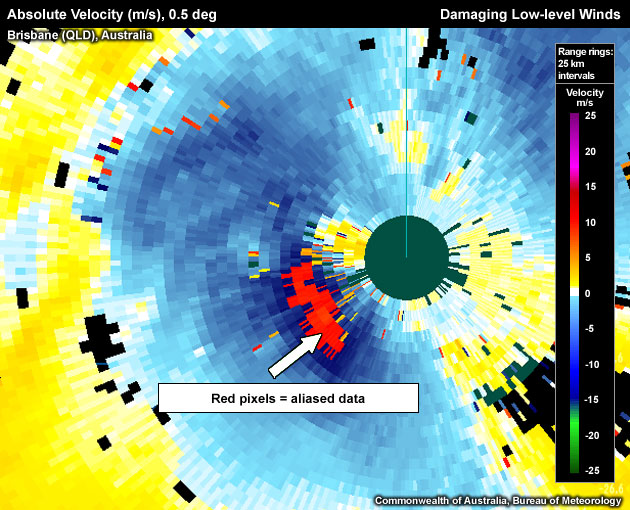
Measurement of radial winds past the severity threshold of 48 knots with the radar beam centre at approximately 100 metres above radar level. Strongest winds are aliased in red. "Hot" pixels are evident to the northwest of the radar.
- "Hot" velocity data – As damaging winds are often shown as a small area of pixels, poor velocity data could easily be mistaken as true extreme values. To establish pixel value credibility, check that the suspected high velocity pixels exhibit some continuity in space and time.
- Ground clutter breakthrough: It is desirable to obtain radar-based wind estimates as low to the ground as possible, which automatically increases the likelihood of ground clutter breaking into the velocity image.
- The thunderstorm is located too far from radar – Therefore the radar overshoots a shallow layer of damaging near-surface winds.
Examples of Damaging Low-level Winds
Measurement of radial winds around 60 knots near Sydney airport on 2 February 2005 as a supercell tracked across the area. The maximum radial velocity pixels are located around 100 m above radar level.
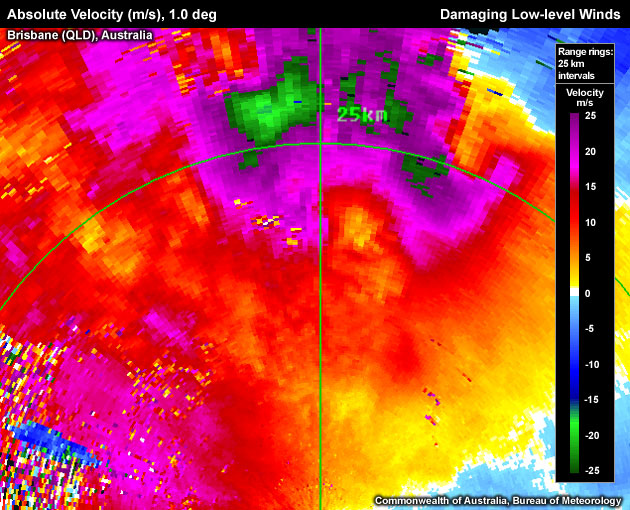
Destructive radial winds of 34.4 m/s (~69 knots) in the rear-flank downdraft region of a northeastward tracking supercell south of Brisbane. These radial winds were observed around 400 m above radar level.
Destructive radial winds of 35.8 m/s (~72 kts) at ~700m ARL associated with "The Gap" storm west of Brisbane. Note the ground clutter breakthrough west of the radar location.
Damaging Low-level Winds Look–a–Likes
"Hot" pixels Either due to dual PRF technique (increases Nyquist velocity without decreasing maximum unambiguous range), or ground clutter affecting the velocity pixels.
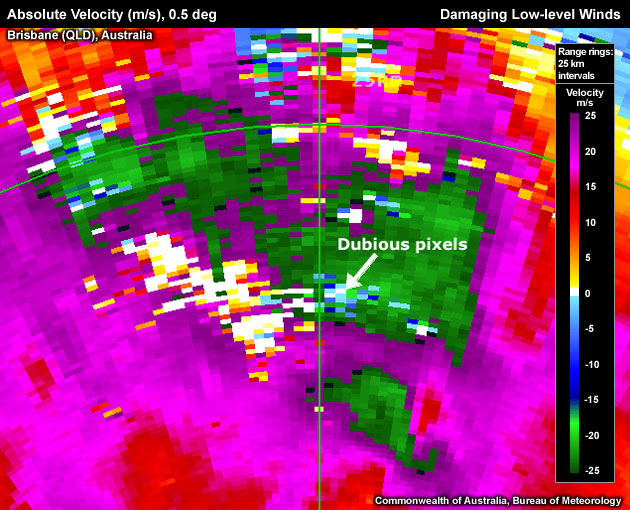
Low velocity tilt of the Gap storm west of Brisbane seemingly showing aliased outbound velocities that folded back onto the zero line (suggesting that the measured speed is twice the Nyquist velocity of 27.2 m/s, or 54.4 m/s ~ 109 knots). Note that along the radial containing the "dubious" pixel, unphysical pixel to pixel velocity jumps of 24 m/s occur. Apart from the inflated magnitude of the signature, however, the overall signature still shows damaging low-level winds.
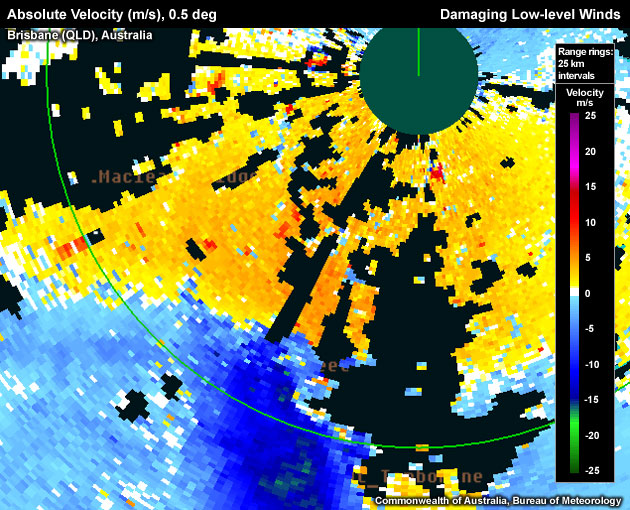
Use the radio buttons or click the image to switch between reflectivity and velocity imagery:
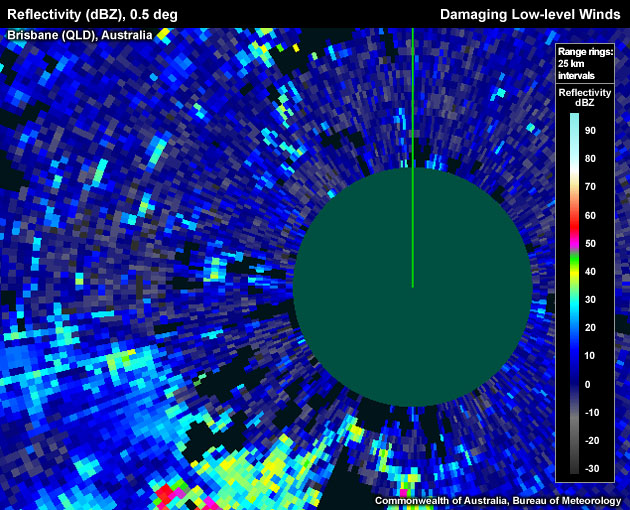

The velocity image seemingly shows three patches of very strong outbound velocities south, west and northwest of the radar. A comparison with the associated reflectivity distribution shows that no convective echoes are linked to any of the above three velocity peaks, which are probably due to ground clutter breakthrough.
Conceptual Model
Identifying a Damaging Low-level Winds signature directly indicates that the thunderstorm is severe. The presence of Damaging Low-level Winds generally suggests a strong downdraft. The most common mechanism for damaging winds is a downburst or microburst where negatively buoyant air with high vertical momentum reaches the surface. Negative buoyancy is primarily generated by evaporation and precipitation loading. In deep layer shear-affected storms, especially in supercells, downdrafts can be enhanced through the additional air parcel accelerations due to dynamically induced vertical pressure gradients.
Other mechanisms that generate damaging surface winds include the downward transfer of high horizontal momentum aloft, usually from a jet , brought down to the surface through a downdraft or vertical mixing.
Finally, very strong surface winds can be created near supercells through large horizontal pressure gradients due to the formation of a storm scale low (low level mesocyclone).
Damaging winds should definitely be included on the warning with upgrades to destructive winds if the surface winds are likely to reach 67 knots or 125 km/hr.
Determining Thunderstorm Classification
Low Level Damaging winds could be produced in all of the conceptual models we have included in this module.
To help determine the classification of the thunderstorm you are observing, use the following flow chart to help diagnose which thunderstorm conceptual model you should consider more closely
Diagnosis
Once you have confidently identified a Damaging Low-Level Winds signature, this section will help you estimate the storm severity associated with it. Generally, the spatial and temporal scales of a signature are loosely related to the updraft strength. In other words, the larger and/or more long–lived the signature, the stronger the updraft that produced it. In velocity-based signatures, updraft severity can usually also be gauged by the magnitude of the measured radial velocities. Examining a storms overall temporal evolution will suggest whether the storm is becoming more or less severe. Radar signatures and associated storm developments can also be time-shifted relative to each other, as is the case in supercell tornadoes that occur during the collapse of the parent storm.
When comparing signatures to diagnose relative severity, keep in mind that it is assumed that signatures are sampled at equal ranges from the radar. Otherwise, a storm sampled at greater range (with a wider beam) can appear to be weak and/or weakening, while a storm sampled at a closer range (with a narrower beam) can appear to be strong and/or strengthening.
Degree of Severity
- Magnitude of the measured radial velocities – The stronger the radial velocities along the radar beam, the higher the likelihood of stronger flow on the surface.
- Proximity of radar-observed damaging winds to the surface – The closer a radial wind measurement is to the surface, the higher the chance that most of this wind magnitude will also be present at the surface. The lower the static environmental stability below the radar beam, the higher the likelihood that vertical momentum can be transferred from the beam height to the ground.
- Horizontal extent of the damaging winds – The larger the area of damaging winds the more destruction is likely.
- Longevity of the damaging winds – The longer the damaging wind signature exists, the longer-lived the storm and more damage likely.
Considering these aspects of Low Level Damaging Winds will help to determine overall the severity of the storm. The presence of Damaging Low-level Winds is one of the few signatures that can influence you directly into issuing a severe thunderstorm warning. Generally, radar information should never be used in isolation and should always be considered in conjunction with the near storm environment and any reports.
Most Likely Convective Hazards
If a thunderstorm has been determined to be severe and possesses a Damaging Low-level Winds signature, the following convective hazards should be considered to be included in the severe thunderstorm warning:
- damaging winds, with some consideration to upgrading the warning to include destructive winds, especially with observed winds of above 67 knots close to the surface.
See Conceptual Models for more details on why particular severe weather should be included.
References/Addendum
None at this time.