«- back to print version table of contents
Single Cell
Detection
The terminology "single cell" refers to a radar reflectivity signature of a storm top which is associated with a dominant longer-lived updraft of a multicell thunderstorm or a supercell. For example, the Single Cell signature aims at identifying supercells and other shear–enhanced dominant updrafts. For example, supercells possess updrafts that are comparatively large, steady, long-lived and tend to move anomalously (e.g., not with the steering flow). To determine if the signature you are seeing is a Single Cell, use the criteria below.
Reflectivity: PPI/Plan View
Determining Updraft Location:
- Step up in elevation scans until you run out of >50 dBZ echoes.
- Step down one elevation scan. This is the echo top.
- Is there one or more >50 dBZ echoes that are steadier, larger, longer-lived and that move anomalously in comparison with other cores in the vicinity? If yes, you have a Single Cell signature.
Potential Difficulties in Detection
- Radar sampling – The thunderstorm is too close to the radar therefore the radar undershoots the storm top (inside the "cone of silence").
Examples of Single Cells
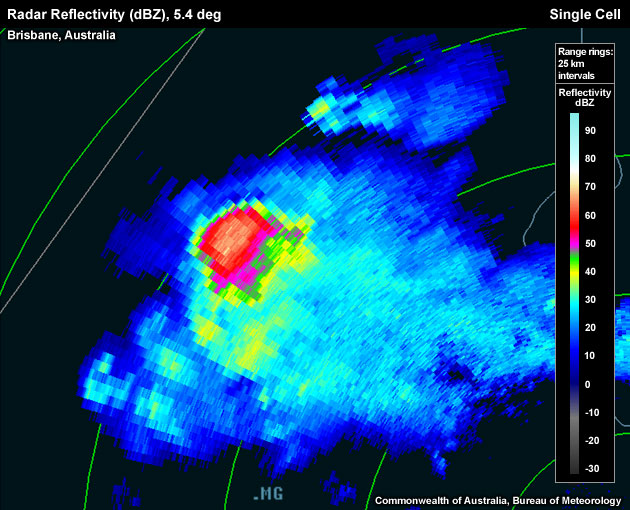
PPI slice through a cell at approximately 9.5 km above radar level. This storm is a supercell.
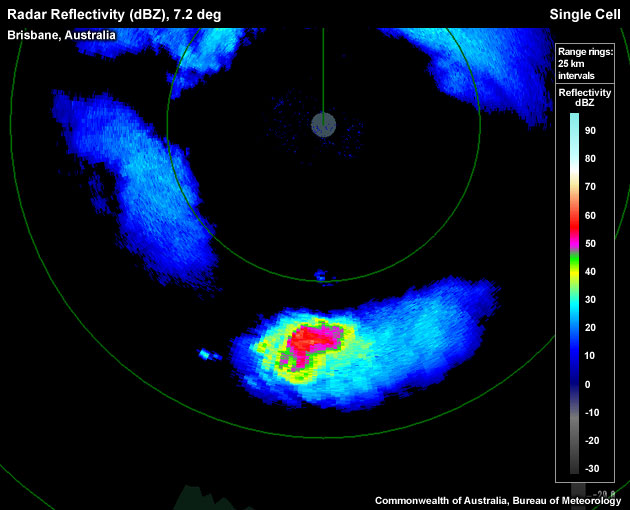
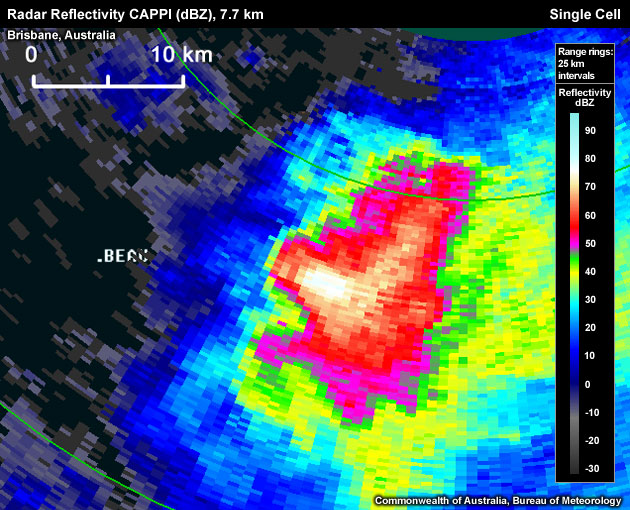
PPI slice through a cell at approximately 9.0 km above radar level. This storm is a supercell.
This loop shows the gradual emergence of two dominant, single cell echo tops in a splitting supercell case. The system starts off with a tightly grouped multicell cluster possessing a common anvil. Then, two single cell signatures begin to emerge in both the left- and right-moving storms. In particular, the left-mover retains its multicellular character, even after the splitting process.
Single Cell Look–a–likes
- Multicellular pulse thunderstorms: in weaker deep layer shear environments storms tend to be multicellular in nature with several collocated updrafts in different stages of development. At any one scan it may seem as though one of the pulse storms is a single cell with one dominant reflectivity signature, but it may merely be one or more shortlived cells developing and dissipating within a scan or two (~20 minutes). Be sure your longer-lived "dominant cell" is the same cell as in previous scans. Looping the images can help with this identification process.
Conceptual Model
A Single Cell signature is used as one of the many signatures that might indicate a severe thunderstorm if the single cell radar echo can be interpreted as a supercell or other dominant, longer–lived elevated core in a moderate to strong deep layer shear environment.
In stronger deep layer shear environments (0–6 km shear exceeding 30–40 knots), single cell signatures may indicate a supercell. Supercells generally can produce all four of the severe convective hazards used to define a severe thunderstorm in Australia. A climatology performed in the US on 2007 events confirmed that supercells produce severe weather more frequently than other morphologies, and also produce more intense severe weather (Duda & Gallus, 2010). Large hail, damaging winds and heavy rainfall are likely to occur. Tornadoes should also be considered, although only about a quarter of supercells are tornadic (Duda & Gallus, 2010)
For more statistics on the likelihood of supercellular severe weather, see the generic Supercell Conceptual Model.
Determining Thunderstorm Classification
To help determine the classification of the thunderstorm you are observing, use the following flow chart to help diagnose which thunderstorm conceptual model you should consider more closely.
A "single cell" signature narrows the underlying thunderstorms classification down to two storm types: Pulse Severe or Supercell. As we are emphasising the steadiness of the single cell signature in moderate to strong deep layer shear, most of the meaningful single cell signatures belong to marginal or fully–fledged supercells.
Diagnosis
Once you have confidently identified a Single Cell signature, this section will help you estimate the storm severity associated with it. Generally, the spatial and temporal scales of a signature are loosely related to the updraft strength. In other words, the larger and/or more long–lived the signature, the stronger the updraft that produced it. In velocity-based signatures, updraft severity can usually also be gauged by the magnitude of the measured radial velocities. Examining a storm’s overall temporal evolution will suggest whether the storm is becoming more or less severe. Radar signatures and associated storm developments can also be time-shifted relative to each other, as is the case in supercell tornadoes that occur during the collapse of the parent storm.
When comparing signatures to diagnose relative severity, keep in mind that it is assumed that signatures are sampled at equal ranges from the radar. Otherwise, a storm sampled at greater range (with a wider beam) can appear to be weak and/or weakening, while a storm sampled at a closer range (with a narrower beam) can appear to be strong and/or strengthening.
Degree of Severity
As the Single Cell signature in moderate to strong deep layer shear is a representation of an organised multicell or supercell thunderstorm, there are certain characteristics that can be investigated to help diagnose the likelihood of the severity of the thunderstorm.
- Horizontal size of the single cell signature, as measured through the extent of the 50 dBZ echo top.
The larger the area of >50 dBZ echoes in a CAPPI level set according to the nomogram, the greater the volume of hail within the ideal hail growth layer, which in turn is a proxy for updraft mass flux
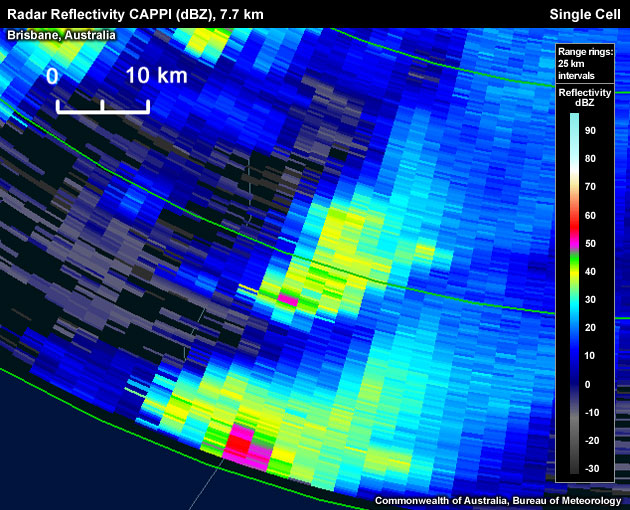
Only a couple pixels exceed 50 dBZ within the CAPPI level.
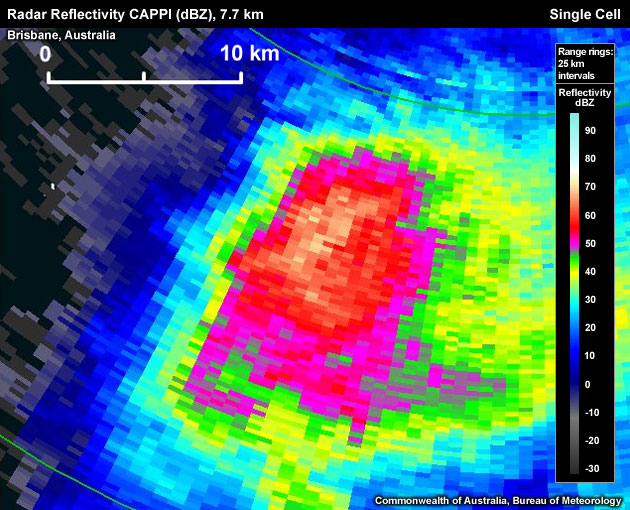
A large area of > 50 dBZ pixels within the CAPPI level.
- Maximum dBZ – The larger the maximum dBZ value in the 2 cm hail CAPPI plane, the more confidence the user can have that the echoes represent large hail.

Maximum reflectivity is approximately 50 dBZ.
Maximum reflectivity is approximately 80 dBZ.
- Longevity – > 50 dBZ pixels "breaking through the CAPPI" level for longer amounts of time should increase confidence that the underlying updraft is "stabilised" by the interaction with deep layer shear.
Loop of >50 dBZ echo "breaking through the CAPPI". Note the storm in the steady western storm persisting, whereas the eastern storm is much less steady.
- Anamalous Storm Propagation – The more anomalous the movement of the "single cell" in comparison to the deep layer background flow and/or the motion vectors of other thunderstorms in the region, the more likely it is that this thunderstorm has or can obtain supercell attributes, given moderate or higher deep layer shear.
This loop shows the gradual emergence of two dominant, single cell echo tops in a splitting supercell case. The system starts off with a tightly grouped multicell cluster possessing a common anvil. Then, two single cell signatures begin to emerge in both the left and right moving storms. In particular, the left-mover retains its multicellular character, even after the splitting process.
Considering all these aspects of the Single Cell signature will help to determine overall whether you are dealing with a significant signature. However, radar information should never be used in isolation and should always be used in conjunction with the near storm environment and any reports.
Most Likely Convective Hazards
If a thunderstorm featuring a single cell signature in a moderate to strong deep layer shear environment has been determined to be severe, all of the following convective hazards should be considered to be included in the severe thunderstorm warning:
- Damaging winds – due to the indication the thunderstorm is an organised multicell or supercellular. Both storm types possess strong updrafts, therefore strong downdrafts are possible
- Large hail – a longer–lived high reflectivity single cell echo indicates prolonged residence times of larger hydrometeors in cold thermal layers (–10 °C to –30 °C) conducive to hail growth
- Heavy rainfall resulting in flash flooding – steadier storms in a moderate deep layer shear environment can deliver more continuous and/or intense precipitation. Flash flooding is particularly a consideration if such storms move slowly or several such storms train across the same location.
- Tornadoes – in stronger deep layer and strong low–level shear, single cell signatures indicating a supercell indirectly harbour the risk of supercell tornadoes. However, based on Duda and Gallus (2010) only 28% of supercells are tornadic. These odds increase in storm environments with strong 0-1 km shear and low Lifted Condensation Levels (LCLs).
See Conceptual Models for more details on why particular severe weather should be included.
References/Addendum
Duda, J.D. and W.A.Gallus Jr., 2010: Spring and Summer Midwestern Severe Weather Reports in Supercells Compared to Other Morphologies. Weather and Forecasting 25 pg 190-206.