«- back to print version table of contents
Storm Top Divergence
Detection
Storm top divergence refers to a diverging wind field in the vicinity of the storm top. To determine if you are seing a Storm Top Divergence signature, follow the techniques illustrated in the sections below.
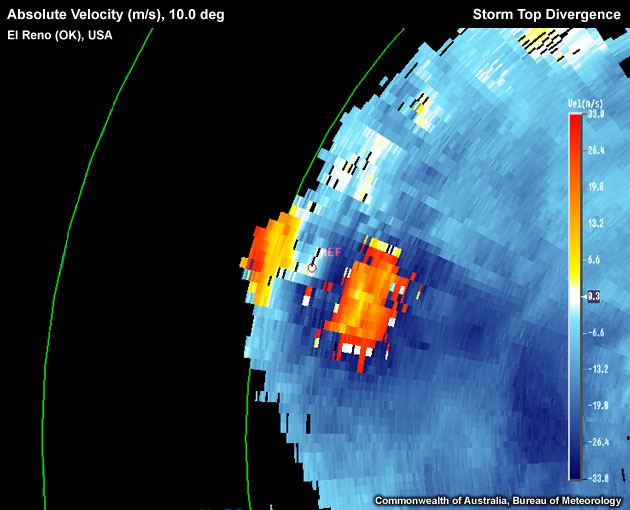
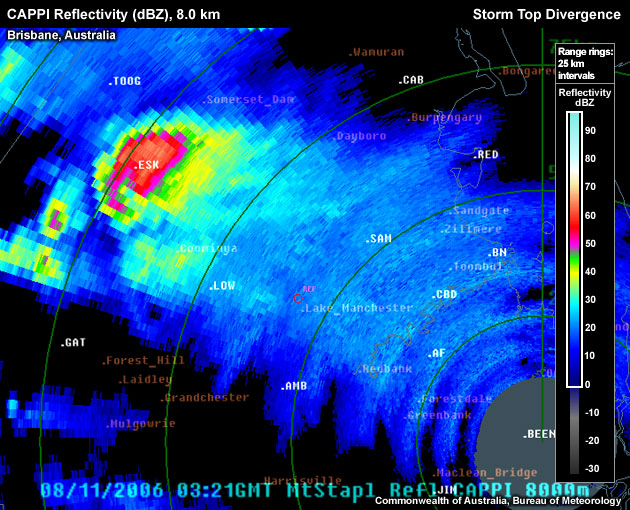
Aliased Storm Top Divergence signature located approximately at the storm core top.
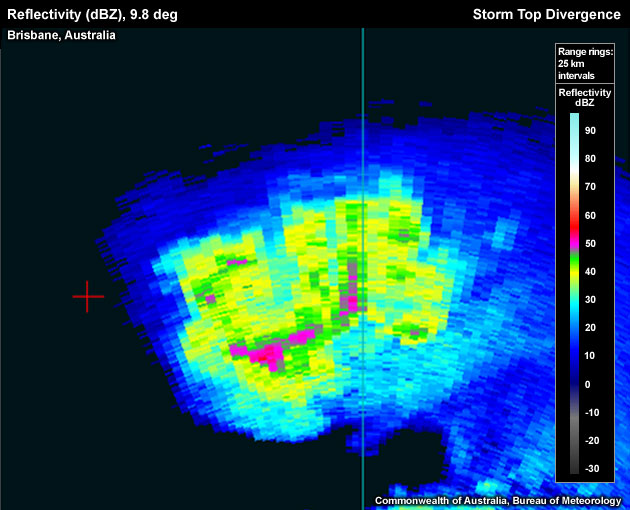
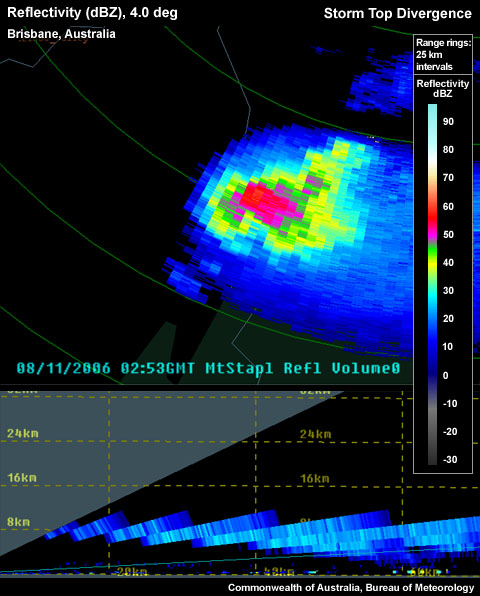
Reflectivity: PPI/Plan View
Determining updraft location:
- Step up in elevation scans until you run out of >50 dBZ echoes.
- Step down one elevation scan.
- Set a reference point in the vicinity of the 50 dBZ echo. Note: if the background flow is strong, the divergence signature may be upwind of the storm top.
- Switch to the velocity field.
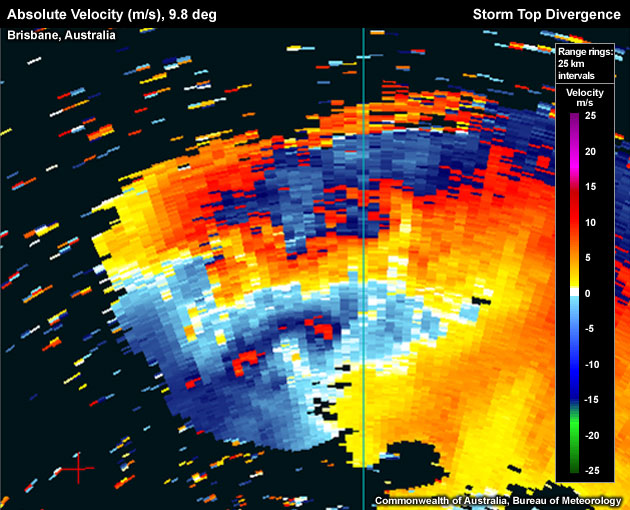
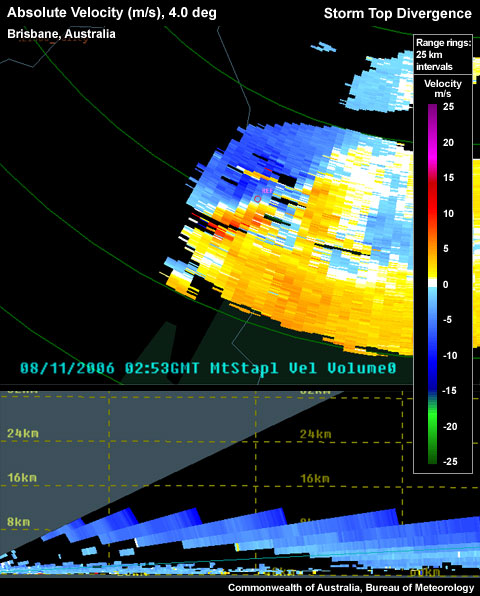
Velocity: PPI/Plan View
- Start with stepping up or down by one elevation scan.
- Is there an area of outbound radial velocities downrange and inbound radial velocities uprange from the reference point? If yes, a Storm Top Divergence signature is present.
Note: depending upon the background flow, the inbound and outbound echoes may not be displayed as a symmetric inbound–outbound velocity pair, as the jet–level divergence signature may translate rapidly. Also, especially for storms close to the radar, a steeply tilted radar beam might only sample the inbound or outbound branch of the divergent flow at storm top level. Moreover, aliasing is common in this signature due to the high flow velocities (often 50–100 knots) at this altitude. See the examples section for a demonstration of this.
Potential Difficulties in Detection
- Radar Sampling:
- Unreliable velocity data – "hot pixels".
- Resolution degradation as range increases – Radar sampling degrades as averaging becomes more enhanced due to wider beam widths.
- Aliased data – Typically, velocity data is aliased in this signature purely due to the large velocity values observed as a result of divergence and/or the background flow at the altitude.
- In particular for storms close to the radar, the tilted radar beam might only sample one of the two branches of the divergence signature, especially if the divergent layer at storm top level is shallow or the signature is located close to the radar.
- The thunderstorm is too close to the radar – Storm top is not visible as the beam is too low.
- Asymmetric divergence – Due to rapidly translating storms.
- Individual cell divergence masked in multicells affect the velocity distribution at storm top level.
Use the radio buttons or click the image to switch between reflectivity and velocity imagery:
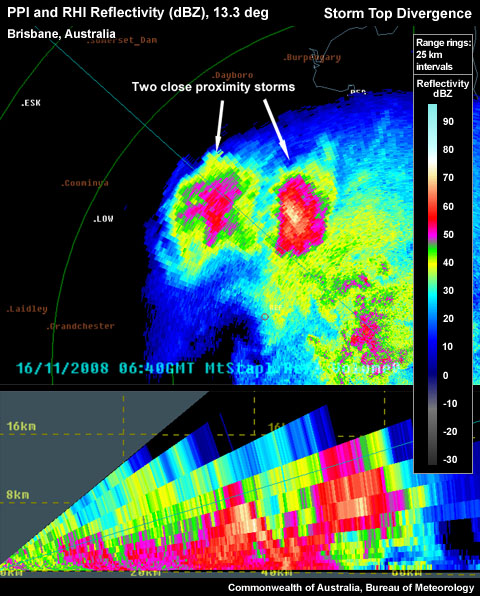
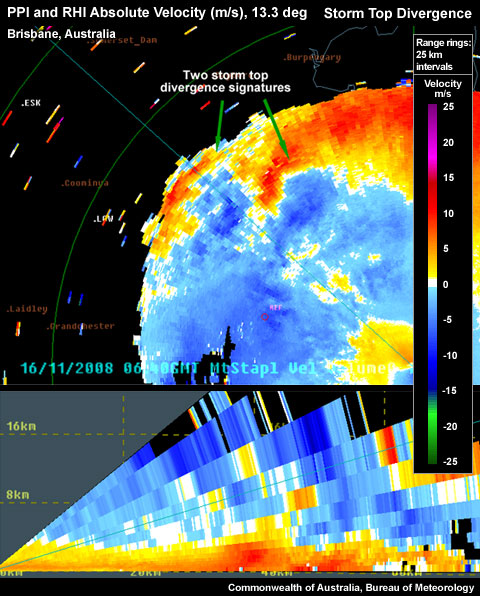
Two storms in close proximity to each other, both with storm top divergence that is getting more difficult to detect due to both signatures interacting with each other.
- Lack of targets – Due to the very dry air, few ice particles are present.
Examples of Storm Top Divergence
Use the radio buttons or click the image to switch between reflectivity and velocity imagery:
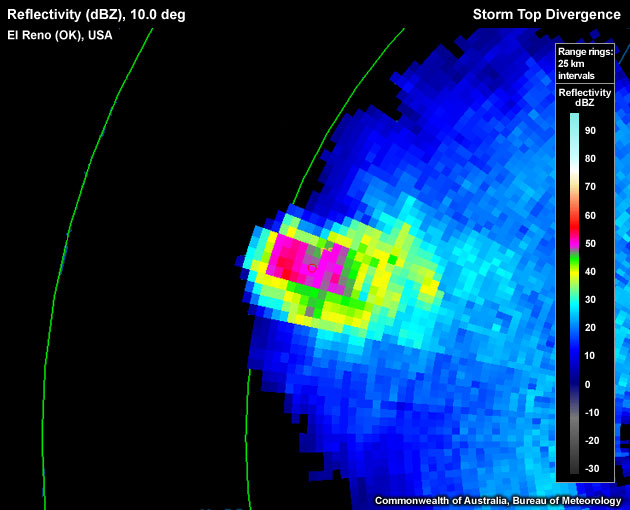
Aliased Storm Top Divergence signature located approximately at the storm core top.
Use the radio buttons or click the image to switch between reflectivity and velocity imagery:
Aliased Storm Top Divergence signature located approximately at the storm core top.
Use the radio buttons or click the image to switch between reflectivity and velocity imagery:
Storm Top Divergence signature located at approximately storm core top. Note the outbound branch of the divergence signature is small due to the signature only just being captured by the radar beam.
Use the radio buttons or click the image to switch between reflectivity and velocity imagery:
Aliased Storm Top Divergence signature located approximately at the storm core top.
Storm Top Divergence Look–a–likes
- Convergence – This signature appears very similar to divergence, with the inbound and outbound wind fields exchanging positions along the radar beam.
- Aliased data – With strong wind velocities aloft, data is often aliased. If this is not recognised, it is possible to see an area of inbound and outbound velocities that are seemingly diverging. Note: To avoid this mistake, make sure there is a white (or zero radial velocity) isodop separating the two wind fields. Usually aliasing will jump from maximum inbound to maximum outbound radial velocities.
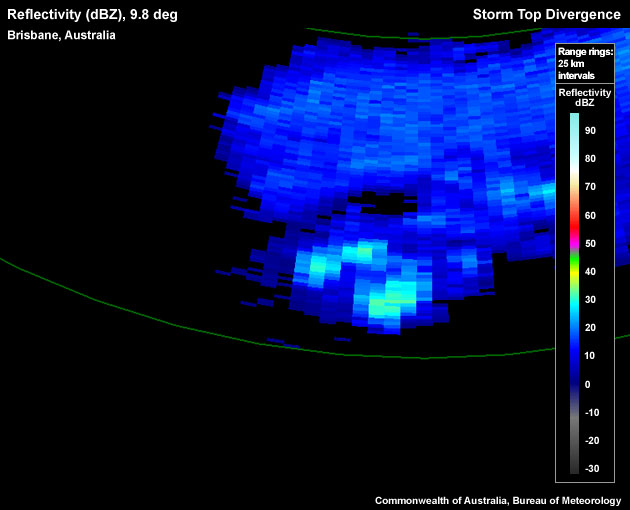
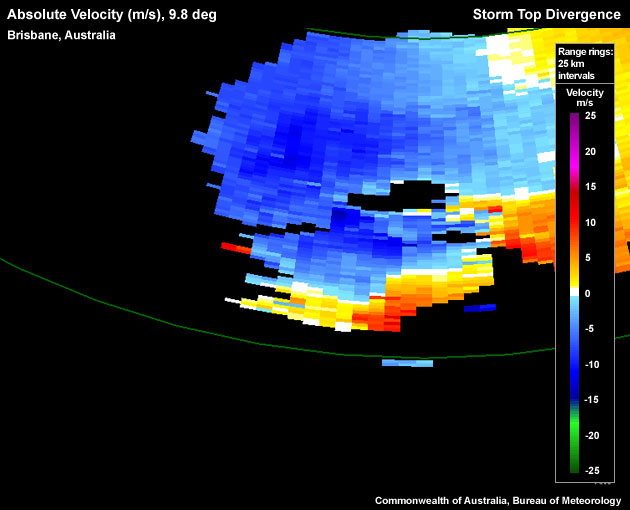
Use the radio buttons or click the image to switch between reflectivity and velocity imagery:
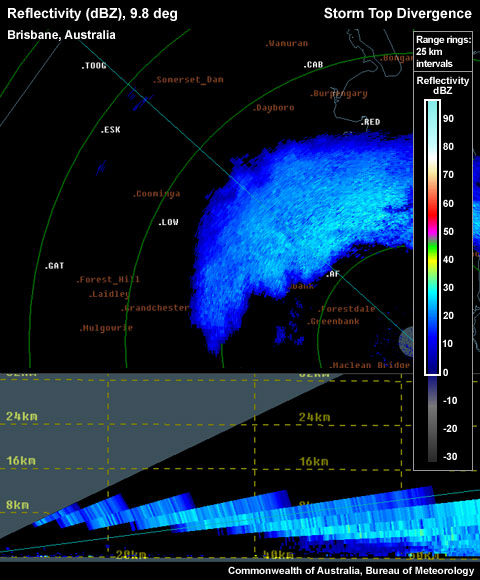
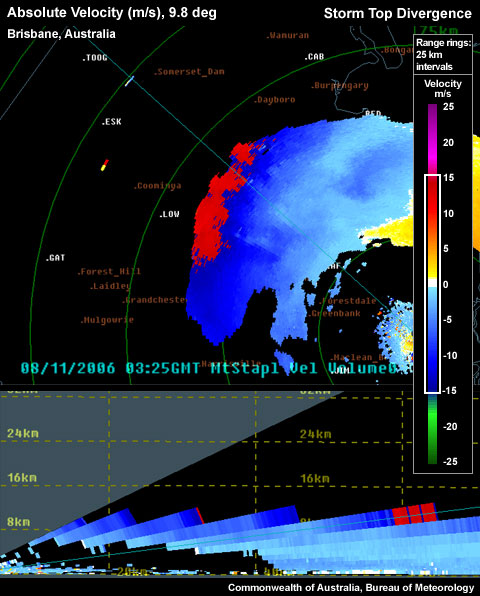
Strong inbound flow, aliased, which looks like a Storm Top Divergence signature in the absolute velocity. Corresponding reflectivity fields show no storm top.
Corresponding CAPPI fields shows a storm top located ~50 km away from the false divergence signature evident in the previous imagery.
- Divergence signature not in the vicinity of the storm top – As the divergence signature is representing the outflow from the strong updraft, it is necessary that the signature is in the vicinity of the updraft/storm top.
Conceptual Model
Strong storm top divergence is used as one of many signatures suggesting a severe thunderstorm. The presence of a significant Storm Top Divergence signature indicates a strong updraft, as the upward velocity in a strong updraft is simply evacuated as outflow at the top of the thunderstorm. The intensity of the divergence is therefore positively correlated to the intensity of the updraft (Witt & Nelson, 1990).
A strong updraft increases the chances of all four severe weather types, especially large hail and damaging winds. A study by Witt and Nelson (1990) derived a useful relationship between maximum storm top divergence and probabilities of maximum hail size (for more see diagnosis tab). Damaging winds are included, as a strong updraft is likely to produce a strong downdraft, especially if large hail is expected.
Determining Thunderstorm Classification
Storm Top Divergence signatures can be found in all three of the storm types listed here. To help determine the classification of the thunderstorm you are observing, use the following flow chart to help diagnose which thunderstorm conceptual model you should consider more closely.
Diagnosis
Once you have confidently identified a Storm Top Divergence signature, this section will help you estimate the storm severity associated with it. Generally, the spatial and temporal scales of a signature are loosely related to the updraft strength. In other words, the larger and/or more long–lived the signature, the stronger the updraft that produced it. In velocity–based signatures, updraft severity can usually also be gauged by the magnitude of the measured radial velocities. Examining a storm's overall temporal evolution will suggest whether the storm is becoming more or less severe. Radar signatures and associated storm developments can also be time–shifted relative to each other, as is the case in supercell tornadoes that occur during the collapse of the parent storm.
When comparing signatures to diagnose relative severity, keep in mind that it is assumed that signatures are sampled at equal ranges from the radar. Otherwise, a storm sampled at greater range (with a wider beam) can appear to be weak and/or weakening, while a storm sampled at a closer range (with a narrower beam) can appear to be strong and/or strengthening.
Degree of Severity
The stronger the maximum radial velocity difference, ΔV, is over the divergent area, the stronger the associated updraft velocity that is required to maintain the divergence. The following nomogram was produced from a study conducted in the United States by Witt and Nelson in 1991, correlating observed hail size to the magnitude of the storm top divergence.
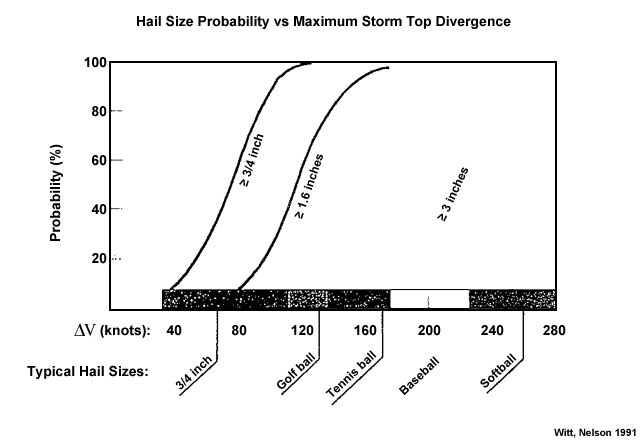
Probability of occurrence of various hail sizes based on the radial velocity differential across the storm top divergent flow DV.
To use the nomogram, perform the following:
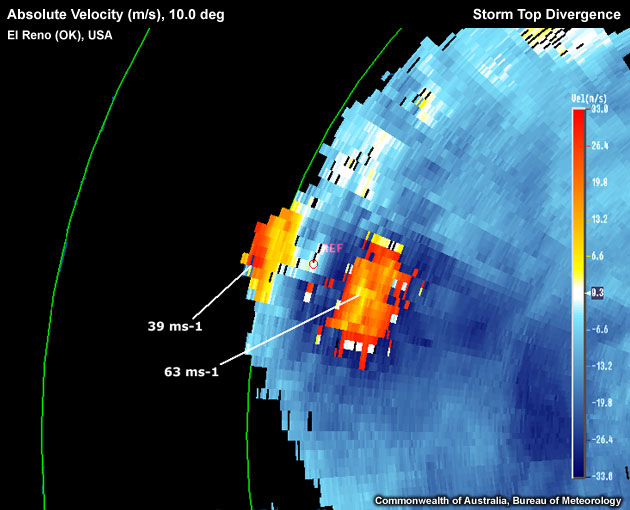
Example radial velocity difference calculation. Maximum inbound wind is aliased to yellow. Maximum outbound wind is aliased to dark blue. Radar Nyquist velocity is 36 m/s (70 knots). Thus, the corrected maximum winds within the signature are 63 m/s inbound and 39 m/s outbound.
- Find the area of divergence
- Read off the maximum inbound and outbound velocity values and correct both for possible aliasing
- Add the magnitudes of these two values together and use this number to find the corresponding probabilistic estimate of the maximum hail size on the nomogram. For the example above: ΔV = (39 + |–63| ) ms-1 = 102 ms-1 (198 knots).
The figures presented enables you to gauge whether you are dealing with a significant signature. Strong storm top divergence (ΔV exceeding approximately 50 knots) strongly suggests the presence of a severe thunderstorm. However, radar information should never be used in isolation and should always be considered in conjunction with information about the near storm environment and any spotter reports.
Most Likely Convective Hazards
If a thunderstorm has been determined to be severe and possesses a strong Storm Top Divergence signature, the following severe convective hazards should be considered for inclusion in the severe thunderstorm warning:
- Damaging winds – a strong updraft, with potential to produce a strong downdraft.
- Large hail – a strong updraft has the potential to produce large hail, providing the updraft extends into the hail growth layer, –10°C to –30°C. Also the nomogram should give some direct indication of the maximum hail size expected from the storm.
See Conceptual Models for more details on why particular severe weather should be included.
References/Addendum
Falk, K., 1997: Techniques for Issuing Severe Thunderstorm and Tornado Warnings with the WSR–88D Doppler Radar, NOAA Technical Memorandum, SR–185.
Witt, A. & S. Nelson, 1991: The Use of Single–Doppler Radar for Estimating Maximum Hailstone Size. J. Meteor, 30, 425–431.