«- back to print version table of contents
Supercell Conceptual Model
Definition of Supercells
Supercell thunderstorms are usually long-lived, intense, relatively large and often anomalously moving convective storms that produce a disproportionate fraction of severe convective weather. Supercells exhibit deep rotation within and near the storm’s updraft known as a mesocylone. For rotation associated with a convective storm to be classified as a mesocyclone, the vortex generally needs:
- to be of storm scale (~2-10 km in diameter),
- have reasonable vertical depth (~3 km),
- have a sufficient duration (~two successive radar volume scans),
- and meet a minimum strength criterion (rotational velocity of ~15 ms-1 or vertical vorticity of ~10-2 s-1).
Conceptual Supercell Formation and Evolution
The initial evolution of a persistent updraft embedded in deep layer shear shows some variations which depend on the type of vertical shear profile. In unidirectional vertical shear, horizontal vorticity inherent in the vertical shear profile is tilted into the vertical by the updraft to yield a vertical vorticity couplet of opposite signs or counter-rotating vortices.
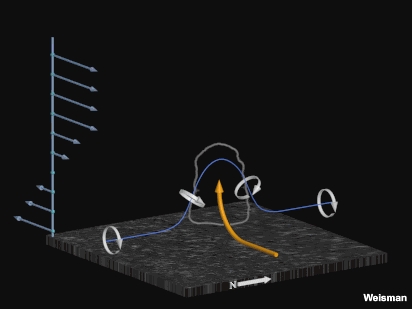
Fig. 1: Tilting of horizontal vortex lines by an updraft in unidirectional shear.
Initially, these vortices form on the left and right flanks of the updraft and are associated with dynamic lows. The rotation-induced perturbation pressure lows associated with the above circulations are also referred to as nonlinear perturbation pressure lows where the perturbation pressure is proportional and opposite in sign to the square of the vertical vorticity (see Bluestein 1993, p. 468).
![]()
Within these storm-scale lows, the pressure is lowest at midlevels where the updraft (and hence the tilting of horizontal vorticity) is strongest.
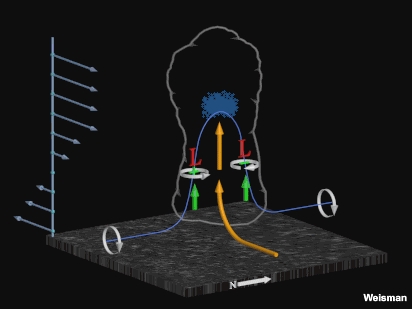
Fig. 2: Conceptual model of dynamically driven storm-scale lows associated with the midlevel circulations near the updraft flanks.
As a result, an enhanced upward-directed perturbation pressure gradient force below both vortices promotes the development of new updrafts near the centre of each midlevel vortex (Fig. 2). This development widens the original updraft through growth of strong new updrafts on the left and right flank. A downward pointing vertical pressure gradient force develops between the two flanking updrafts which, aided by the cooling effects associated with and descent of a precipitation core, can lead to storm splitting (Fig. 3).
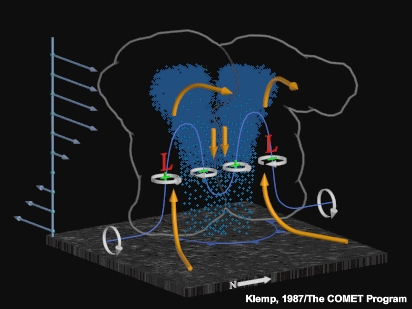
Fig. 3: Schematic of preferred updraft growth near the flanking lows, leading to the onset of storm splitting.
In a unidirectional shear profile, equally intense left- and right-moving storms develop, while left-movers are preferred in counter-clockwise hodographs and right-movers in clockwise hodographs (Fig. 4).
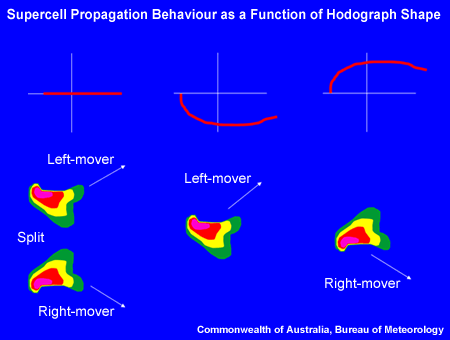
Fig. 4: Schematic that shows preferred supercell propagation behaviour as a function of the hodograph shape.
The reason why curved hodographs imply a preference for left- or right-movers lies with a second mechanism of how deep-layer shear creates perturbation pressure patterns in and around an updraft. Bluestein (1993, pp. 463-465) derives a second relationship stating that storm-scale perturbation pressure is related to the projection of the environmental vertical shear vector onto the vertical velocity gradient associated with the updraft:

The environmental shear-induced perturbation pressure is commonly referred to as the linear perturbation pressure. Analogous to the nonlinear perturbation pressure setting up within storm-scale rotation centres, the linear perturbation pressure is maximised near the periphery of the updraft according to an "upshear highs downshear lows" rule (Fig. 5):
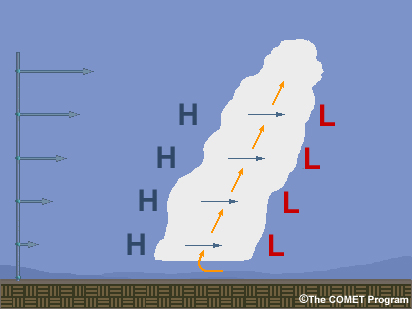
Fig. 5: Arrangement pattern of the linear perturbation pressure associated with a straight-line vertical shear profile. Perturbation highs set up on the upshear side, perturbation lows on the downshear side.
The arrangement of the linear pressure perturbations in curved hodographs changes with height due to the shear vector orientation changing with height. Furthermore, the strongest vertical velocities within the updraft, and therefore the strongest horizontal gradients thereof, occur in the midlevels. It is at that level that the strongest linear perturbation lows and highs setup. In counter-clockwise hodographs, the dominating midlevel perturbation low is found on the northern flank of the updraft, encouraging northward propagation of the storm and (given a westerly steering flow) overall leftward motion as indicated in Fig. 6.
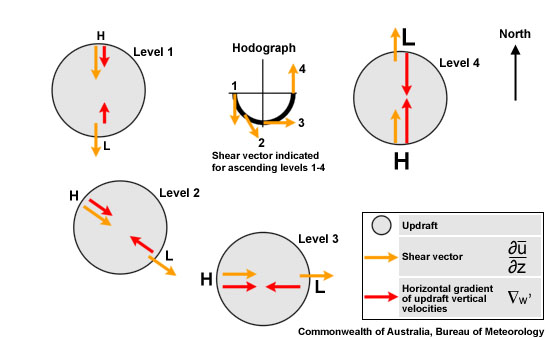
Fig. 6: Changing arrangement of upshear high and downshear low linear pressure perturbations around an updraft embedded in a counter-clockwise hodograph. The yellow arrows show the environmental vertical shear vector at a particular level, the red arrows show the corresponding horizontal gradients of the updraft vertical velocities. The strongest linear perturbation low sets up at midlevels on the northern flank, encouraging new updraft formation there and thus overall leftward motion (that is northeastward motion in westerly steering).
Once the storm moves off the hodograph, either due to the linear or the nonlinear shear effect or the hodograph curvature itself, the tilting of environmental horizontal vorticity changes character compared to the process shown in Fig. 7a. Movement off the hodograph implies that environmental horizontal vorticity is more aligned with the storm-relative inflow vector (Fig. 7b) which, once tilted, leads to vertical vorticity of one sign dominating rather than a vortex couplet as shown in Fig. 5. Vorticity vectors that point across the storm-relative inflow vector are referred to as crosswise vorticity; those aligned with it along it are referred to as streamwise vorticity. Left-moving and right-moving storms have much more potential for intensification as they ingest a higher proportion of streamwise vorticity compared to those cells that dont move deviantly.
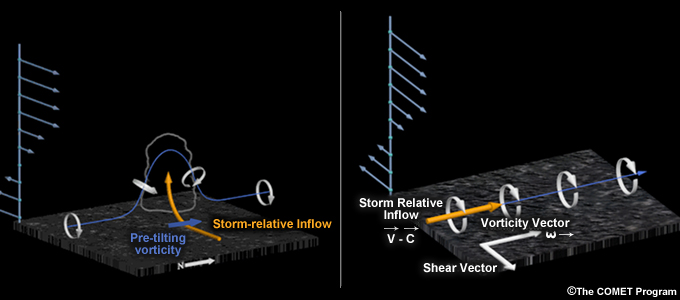
Fig. 7: Tilting of crosswise vorticity (a) and streamwise vorticity (b).
Integrated through the whole depth of a storms inflow layer (nominally set at 3 km), the total amount of streamwise vorticity ingested through the inflow is referred to as the storm-relative helicity (Davies-Jones 1984,1990).
Supercell Structure on Radar
The strength, relative steadiness, longevity and association with storm-scale rotation of a supercell updraft leads to an often distinctive four-dimensional arrangement of hydrometeors and storm-scale flow pattern as seen by radar. Embedded within this arrangement are usually several, sometimes even most of the reflectivity and velocity signatures presented in this guide. For a mature, "classic" supercell these signatures usually show a characteristic spatial arrangement relative to each other. The description of this arrangement is the primary goal of this section.
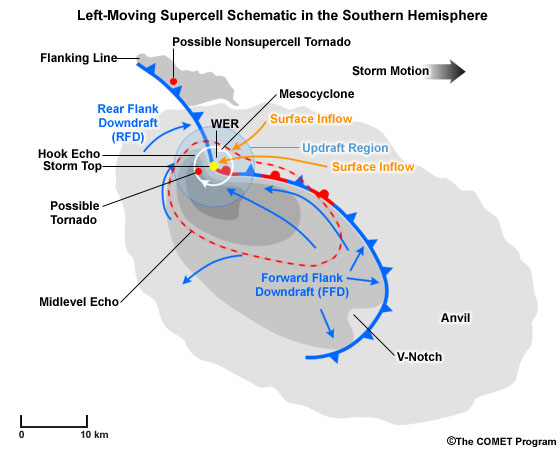
Fig. 1: Conceptual image of a left-moving supercell in the southern hemisphere combining elements observed by satellite, radar and conceptual features. The Anvil and Flanking Line are observable in the visible satellite channel. The bean-shaped grey shaded area marks the near-ground radar reflectivity echo, whereas the red outline shows the corresponding stronger (40 dBZ+) echo at the storms midlevels. Some individual radar signatures and storm structure elements are also shown.
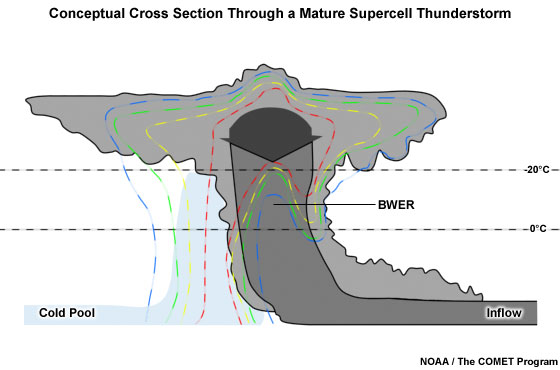
Fig. 2: Cross section through a mature supercell thunderstorm showing a conceptual cloud outline and characteristic reflectivity distribution. The blue shading represents the storm's cold pool.
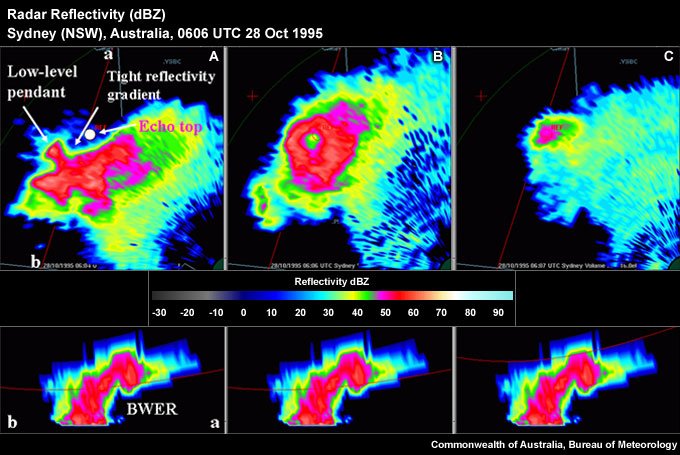
Fig. 3: Three quasi-horizontal slices through the reflective structure of a left-moving supercell. Panel A shows a low-level slice with a pronounced tight low-level reflectivity gradient on the northern flank and a hook echo. Panel B shows a very distinct Bounded Weak Echo Region (BWER) roughly located above the low-level reflectivity gradient and below the storm top shown in panel C. The lower panels shows a vertical cross section through the storm along line ab.
At low levels supercells are often characterised by a sharp, low-level reflectivity gradient on the inflow side of the storm (Figs 1, 2, 3A). This enhanced gradient often extends away from a low-level inflow notch to its west and marks the interface between the low-level inflow and the storms cold pool (Fig. 2) and could exhibit an enhanced low-level convergence signature. If the storm possesses low-level rotation, the circulation would most likely set up near the interface of the low-level updraft and the Rear Flank Downdraft (RFD) in the vicinity of the hook echo (Fig. 1 and Fig. 3). Damaging low-level winds are very likely near the low-level mesocyclone and the adjacent regions of the RFD.
A Weak Echo Region (WER) often extends upward from the low-level tight reflectivity gradient. A WER is a very common feature of any severe storm in a vertically sheared environment. Supercells often contain very intense updrafts that prevent any large hydrometeors from forming until the updraft air has reached anvil level, thus creating a Bounded Weak Echo Region (BWER). A BWER is connected to precipitation descending around the updraft on all sides, including the upshear side (Fig. 2, Fig. 3B). A BWER is best seen as a "doughnut hole" of weaker reflectivity surrounded by much stronger reflectivity at midlevels (Fig. 3B). A mid-level mesocyclone is usually found fairly close to the BWER centre, but a BWER should not be regarded as a vortex centrifuging hydrometeors to larger radii. Intense reflectivity maxima are likely close to the WER or BWER, extending down to near the low-level reflectivity gradient. These gradients mark falling, large hail which is partially melting on the way to the ground. The level around the melting layer for large hail is also a preferred region in which to observe the S-band Three-Body Scatter Spike (TBSS). At this level, and below this level, a V-notch or forward flank notch might be observable in the radar reflectivity (Fig. 1).
At anvil level, near the top of the storm, the high-level 50 dBZ storm top signature is usually found above the BWER at midlevels or the tight gradient at low levels. The storm top often appears as a single isolated echo top; the storm top is "displaced" from the location of the low-level echo core (Figs. 1, 2, 3). At this level a pronounced storm top divergence signature marks the evacuation of air from the updraft interacting with its equilibrium level (usually the tropopause). This outflowing air in itself moves out radially from the updraft as a point source, but strong anvil-level storm-relative winds distort the radial flow field considerably.
Of note is the mesocyclone evolution. Initially, a midlevel mesocyclone forms at the level of maximum vortex tilting. The mesocyclone then grows up and down from midlevels and the RFD forms. Mature mesocyclones show convergent rotation at low levels, pure rotation in the midlevels, and divergent rotation aloft. At low levels, the mesocyclone is part updraft, part RFD with lifting and horizontal vortex line tilting accomplished by the RFD gust front. Higher up, at midlevels, the mesocyclone consist mainly of updraft. At low levels, the thermodynamic stability of the RFD (as it wraps into the mesocyclone circulation) drives whether the low-level mesocyclone occludes and dies or if tornadogenesis occurs.
All of the signatures described in this guide except the "Bow Echo and Strong Rear Inflow Jet" can be found in a mature supercell:
Low-level Signatures
- Damaging Near-Surface Winds
- Hook Echo
- Low-level Convergence
- Low-level Mesocyclone
- Tight Low-level Reflectivity Gradient
Mid-level Signatures
- Forward Flank Notch
- Midlevel Mesocyclone
- Three-body Scatter Spike
Upper-level Signatures
- 50 dBZ Echo Top Height
- Single Cell
- Anomalous Storm Propagation
- Storm Top Divergence
Multi-level Signatures
- Bounded Weak Echo Region
- Very High Reflectivity
- Weak Echo Region
Supercell Environments
The most discriminating environmental parameter usable for forecasting supercell potential is the strength of the deep layer shear. "Deep layer" refers to a height that should at least extend through half the storm depth. For warm season storms, deep-layer shear is typically measured in the 0-6 km layer above ground level. Cloud model simulations by Weisman and Klemp (1982), along with observational studies by Markowski et al. (1998), Rasmussen and Blanchard (1998), and Bunkers (2002), indicate that a vector shear magnitude of roughly 15-20 m/s (30-40 knots) over the lowest 6 km is necessary to support supercells. A large climatology by Thompson et al. (2003) shows that the 0-6 km bulk shear vector magnitude is an excellent discriminator between "ordinary cells", marginal supercells and supercells (Fig. 1).
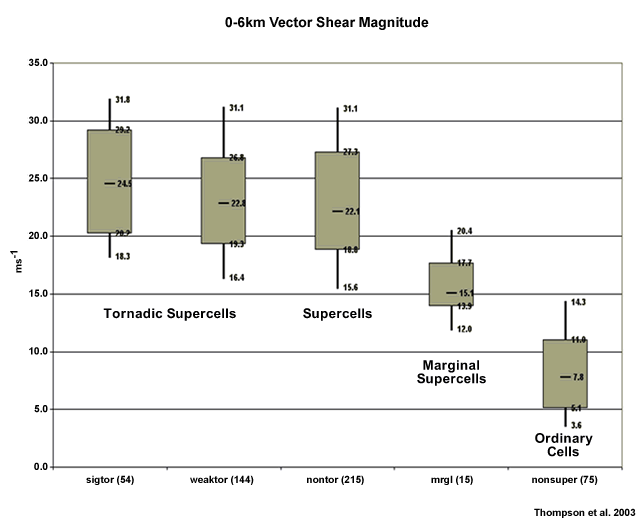
Fig. 1: Discrimination between various storm types using the 0-6 km shear magnitude as the discriminator.
Deep-layer shear, however, is not overly useful in discriminating between tornadic and non-tornadic supercells. Low-level parameters such as the height of the lifted condensation level (LCL) and the 0-1 km shear vector magnitude are far better predictors for this type of discrimination (Fig. 2).
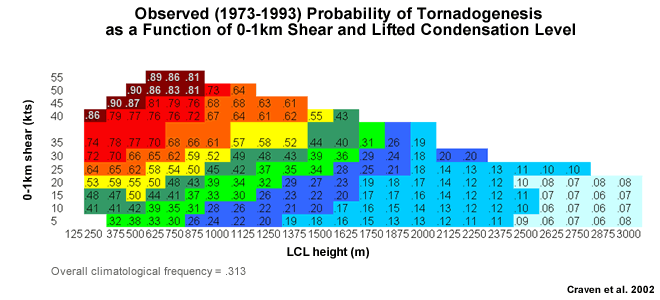
Fig. 2: Probability of tornadogenesis as a function of two storm-environmental parameters: the 0-1 km shear and the height of the Lifted Condensation Level (LCL). Only 1800 LST soundings were used in the underlying climatology of Craven et al. (2002).
Overall, it is now tempting to list a set of environmental ingredients that are required for the probable occurrence of supercells. Such ingredients would be the combination of generic ingredients for (generally) surface-based storms, such as buoyancy and lift, in addition to some type of deep-layer shear criterion to organise the storm.
One such attempt is the supercell composite parameter (Thompson et al., see http://w1.spc.woc.noaa.gov/publications/thompson/stp_scp.pdf) which combines two diagnostics, one for buoyancy and another for storm-scale rotation, with the 0-6 km shear magnitude.
A second, more detailed approach, is the National Thunderstorm Forecast Guidance System (NTFGS) in Australia. Based on mesoscale numerical model input, a range of parameters need to exceed climatologically based (and model-tuned) thresholds for a simple on/off supercell decision (Table 1).
| Surface Lifting | |
|---|---|
| LI (500) OR LI (700) for cool-season TS | ≤ -1 C |
| EL | ≤ -20 C |
| Max Upmotion sigma 0.9988-0.8500 | ≥ 10 hPa/hr |
| | CIN | | ≤ 25 J/kg |
| Cold cloud depth | ≥ 3 km |
| Cool-Season (850hPa Temp <12) | ||
|---|---|---|
| Favourable | Very Favourable | |
| LI (700) | ≤ -2 | ≤ -4 |
| Max shear sigma 0.9875-1.5 -3 km | ≥ 30 | ≥ 35 |
| Warm-Season (850hPa Temp ≥12) | ||
|---|---|---|
| Favourable | Very Favourable | |
| LI (500) | ≤ -4 | ≤ -5 |
| Max shear sigma 0.9875-2.5 - 4 km | ≥ 30 | ≥ 35 |
Table 1: Thresholds for surface-based thunderstorm and supercell on/off decisions within the National Severe Thunderstorm Forecast Guidance System (NTFGS) in Australia.
The above thresholds attempt to quantify "sufficient" buoyancy (LI), chance of initiation (sigma; CIN) and shear for the possible development of supercells. The NTFGS accuracy is limited but the system embodies the useful concept of what type of ingredients of what approximate magnitudes need to overlap to support supercell development.
Demise of a Supercell
There are several ways to see the demise of a supercell, including:
- Its own cold pool eventually cuts off the supply of potentially unstable air ("outflow dominance").
- The storm moves into a thermodynamically or dynamically unfavourable environment.
- An intensifying cold pool induces the storm to transition into a high-precipitation supercell or to grow upscale into a squall line or bow echo.
- The storm interacts with other storms and suffers from seeding, neighbouring outflows being undercut by outflows from neighbouring storms.
Hazards Associated with Supercells
Supercells make up only a small proportion of all deep moist convection, but they are responsible for a disproportionate fraction of high-end severe convective weather. Dudha and Gallus (2010) state that supercells produce severe weather more frequently than other storm types, and also produce more intense severe weather. In their study, supercells accounted for over half of all storm reports in the U.S., with about 91% of supercells producing severe weather.
Destructive Winds
Supercells, on average, produce more severe wind reports, ~6 reports per event, than any other storm type, except Bow Echoes (~15 reports). Destructive winds should be considered over damaging winds due to the supercellular classification (except: if you can confidently diagnose an elevated supercell the downdrafts of which are well insulated from the surface by a deep layer of potentially cold air).
Large Hail
Supercells produce more than two-thirds of all hail reports. Supercells average the highest amount of severe hail reports per hail event, especially for hail greater than 2.5 cm. The particularly strong and longer-lived updraft has good potential to produce large hail by allowing riming to take place within hail growth layer, -10º to -30ºC, for an extended period of time. Some consideration to giant hail should be given when dealing with supercells.
Flash Flooding
Heavy rainfall resulting in flash flooding is not an automatic hazard associated with supercells, in particular for smaller or faster-moving storms. Supercells tend to have a comparatively low precipitation efficiency, but also process inordinate amounts of water vapour. The result of these two opposing drivers for heavy rainfall is that flash flooding is more likely with larger and/or slower-moving supercells.
Tornadoes
The average number of tornadoes produced by supercells is much greater than that from any other storm type. About 15-30% of supercells are tornadic (for example, Dudha and Gallus 2010; Trapp et al. 2005a). However, a higher proportion, 20% to 40%, of low-level mesocyclones are associated with tornadoes. Stronger low-level mesocyclones, especially when embedded in tornadogenesis-supporting storm environments, warrant consideration of a tornado warning.
References/Addendum
Bluestein, H. B., 1993: Synoptic-Dynamic Meteorology in Midlatitudes. Volume II: Observations and Theory of Weather Systems. 593 pages.
Bunkers, M. J., 2002: Vertical wind shear associated with left-moving supercells. Wea. Forecasting, 17: 845–855.
Craven, J. P., H. E. Brooks, and J. A. Hart, 2002: Baseline climatology of sounding derived parameters associated with deep, moist convection. Preprints, 21st Conference on Severe Local Storms, San Antonio, Texas, American Meteorological Society, 643-646.
Davies-Jones, R. P., 1984: Streamwise vorticity: The origin of updraft rotation. J. Atmos. Sci., 41: 2991–3006.
Davies-Jones, R. P., D. W. Burgess, and M. Foster, 1990: Test of helicity as a tornado forecast parameter. Preprints, 16th Conf. on Severe Local Storms, Kananaskis Park, AB, Canada, Amer. Meteor. Soc., 588–592.
Duda, J. D. and W. A. Gallus, 2010: Spring and Summer Midwestern Severe Weather Reports in Supercells compared to other morphologies. Wea. Forecasting, 25: 190-206.
Markowski, P. N., J. M. Straka, E. N. Rasmussen, and D. O. Blanchard, 1998: Variability of storm-relative helicity during VORTEX. Mon. Wea. Rev., 126: 2959–2971.
Rasmussen, E., and D. Blanchard, 1998: A baseline climatology of sounding-derived supercell and tornado forecast parameters. Wea. Forecasting, 13: 1148-1164.
Thompson, R. L., R. Edwards, J. A. Hart, K. L. Elmore and P. Markowski, 2003: Close Proximity Soundings within Supercell Environments Obtained from the Rapid Update Cycle. Wea. Forecasting, 18: 1243-1261.
Trapp, R. J., G. J Stumpf, and K. L. Manross, 2005a: A reassessment of the percentage of tornadic mesocyclones. Wea. Forecasting, 20: 680-687.
Treloar, A. B. and B. N. Hanstrum, 2002: A Study of Australian Warm Season Thundestorms. Weather Services Scientific Conference, 99-100.
Weisman, M. L., and J. B. Klemp, 1982: The dependence of numerically simulated convective storms on wind shear and buoyancy. Mon. Wea. Rev., 110: 504–520.