
Precipitation Estimates, Part 1: Measurement
Table of Contents
I. Introduction
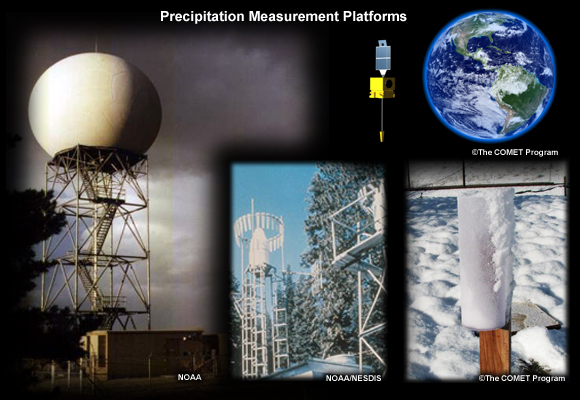
This is part one of a two-module series on estimation of observed precipitation. In this first part we will review the science of precipitation measurement using various platforms.
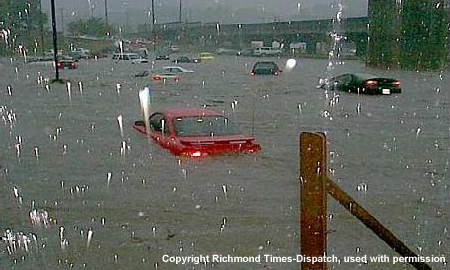
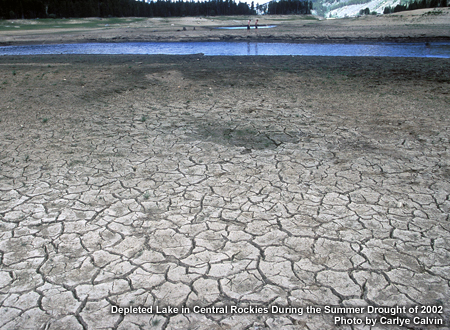
Accurate estimates of both the spatial and temporal distribution of observed precipitation are important for input to river and flash flood models, for forecasting of high impact hydrometeorological events, and for analysis and forecasts of drought and water supply.
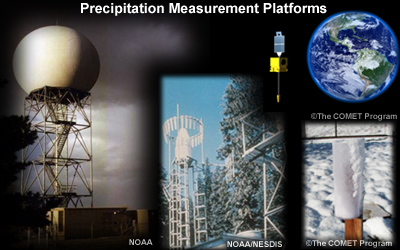
Topics in this module include: the meaning of Quantitative Precipitation Estimation (QPE), measurement tools for estimating observed precipitation, and using climatology in precipitation estimates.
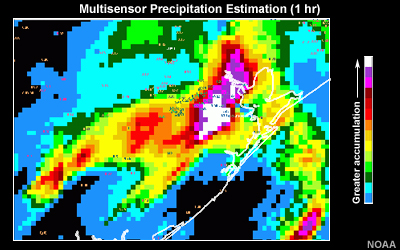
The second module in this series will review the Multisensor Precipitation Estimator (MPE) and related software tools in precipitation estimation.
The MPE tool is used by the U.S. National Oceanic and Atmospheric Administration’s National Weather Service, hereafter referred to as the NWS.
A basic understanding of how radar and satellite are used to estimate observed precipitation is needed to understand the information in this module.
NOAA’s NWS Warning Decision Training Branch (WDTB) Distance Learning Operations Course (DLOC) (http://www.wdtb.noaa.gov/courses/dloc/outline.html)
-
Topic 3, Lesson 6: Precipitation Estimation from radar: (http://www.wdtb.noaa.gov/courses/dloc/topic3/lesson6/player.html)
-
Topic 5, Lesson 23: Radar precipitation Products: (http://www.wdtb.noaa.gov/courses/dloc/topic5/Lesson23/player.html)
Overview of WSR-88D system
(http://www.roc.noaa.gov/NEXRAD_Eye_to_Sky.wmv)
Topic 3 of the NWS Warning Decision Training Branch (WDTB) Distance Learning Operations Course (DLOC) reviews the principles of meteorological Doppler radar. In particular, lesson 6 is recommended for those unfamiliar with how radar is used to estimate precipitation.
Topic 5, lesson 23 may be useful if you are familiar with weather radar but need a quick refresher on the precipitation products associated with the NWS Weather Surveillance Radar- 1988 Doppler (WSR-88D) network.
An overview of the WSR-88D system is available as well for those completely unfamiliar with Doppler radar.
Hydro-Estimator Products page:
http://www.star.nesdis.noaa.gov/smcd/emb/ff/auto.html
For more information about satellite-derived precipitation estimation with the Hydro-Estimator, please
view this VisitView lesson:
http://rammb.cira.colostate.edu/visit/hydro.html
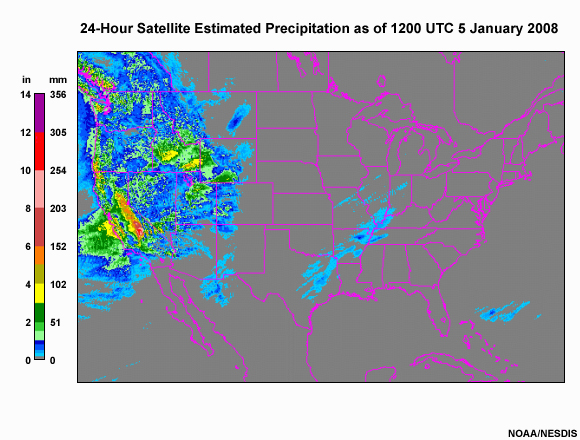
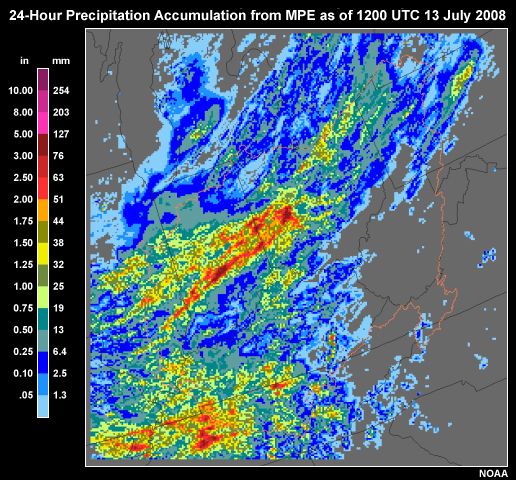
At the time of publication of this module, the Hydro-Estimator is currently used by National Weather Service operations to provide precipitation estimates based in infrared (IR) satellite. [1] Products like this one can be found at this NOAA website.
A VisitView webcast is available for those seeking more detailed information about the Hydro-Estimator.
What is Precipitation Estimation (QPE)?
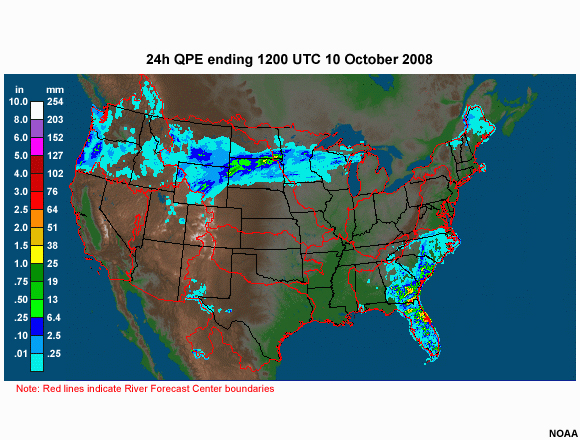
The term Quantitative Precipitation Estimation, or QPE, refers to the estimation of observed precipitation.
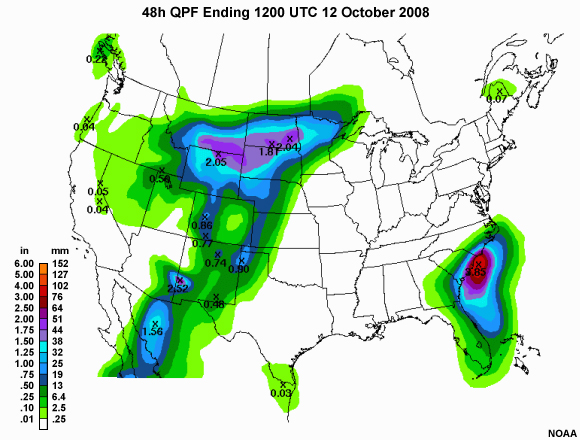
This is different than a forecast of precipitation which is referred to as a Quantitative Precipitation Forecast, or QPF.
Quantitative Precipitation Estimation
-
Observed precipitation is an estimate — tools provide inexact approximations of magnitude and distribution of precipitation
You may wonder why precipitation is only an estimate if it is “observed.” Observed precipitation is only an estimate because the tools used provide inexact approximations of the actual magnitude and distribution of precipitation.
QPE Methods and Tools
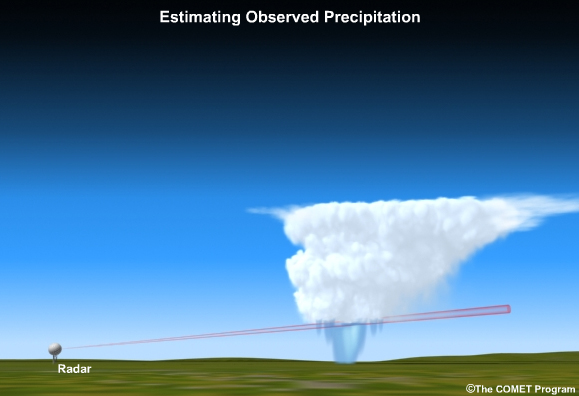
Radar is a remote sensing QPE tool with excellent spatial and temporal resolution. However, radar coverage may be inconsistent from place to place and from storm to storm.
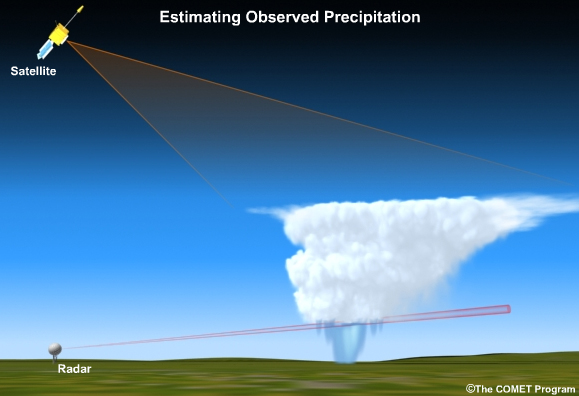
Satellite is another remote sensing QPE tool, but with much coarser resolution than radar.
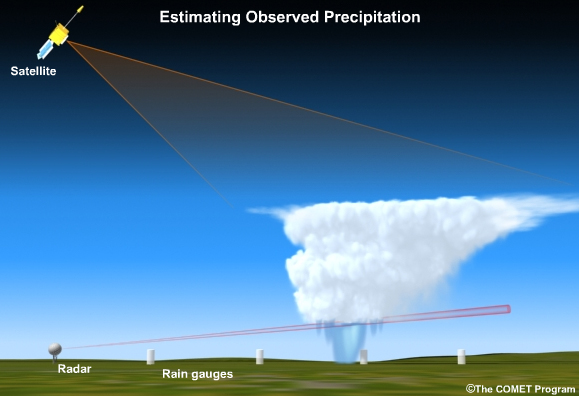
Even rain gauges, which are ground-based measurements, are subject to errors and cannot resolve the spatial detail of precipitation patterns.
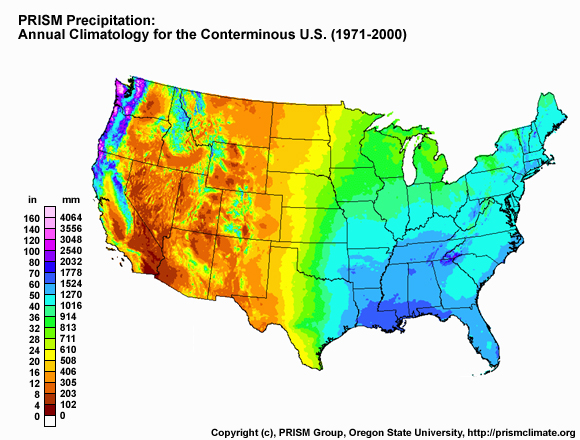
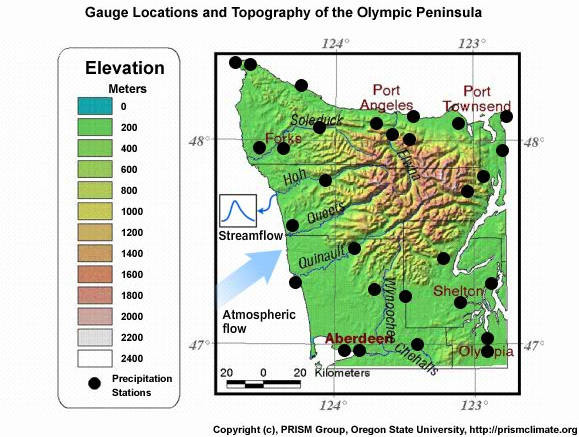
A precipitation climatology is sometimes used to augment the estimates of observed precipitation. This can be very useful in regions where precipitation distribution, and the ability to observe it, is greatly affected by terrain features.
The Parameter-elevation Regressions on an Independent Slopes Model, or PRISM, provides a commonly-used precipitation climatology tool.
For more information on precipitation climatology guidance from Parameter-elevation Regressions on an
Independent Slopes Model (PRISM), see:
http://www.prism.oregonstate.edu/
In This Module
Measurement technologies like radar, satellite, and rain gauges will continue to evolve and improve. The focus of this module is to provide you with the background to make choices about when to use certain observing platforms.
-
Section 2: Remote Sensing of QPE
-
Looks at the remotely-sensed observed precipitation from weather radar and satellite, including the use of radar precipitation climatology
-
-
Section 3: Rain Gauge QPE
- Explores the use of rain gauges
-
Section 4: Precipitation Climatology/PRISM
- Reviews tools based on precipitation climatologies such as the information available from PRISM.
-
Section 5: Summary
Review Questions
1. The primary benefit of radar-derived precipitation guidance is that it provides _____.
Choose the best answer.
The answer is c.
2. Rain gauge observations are not really QPE because rather than being “estimations,” they are real ground-based reports.
Choose the best answer.
The answer is b).
3. PRISM climatology data may be particularly useful for supplementing the data in which area?
Choose the best answer.
The answer is c.
II. Remote Sensing of QPE
Topics in this section include:
-
Relationship between drop size distribution, Z-R relationship, and derived rainfall
-
Impact of snow on radar precipitation estimates
-
Potential improvement with polarimetric radar
-
Radar coverage
-
Radar climatology
-
Satellite QPE
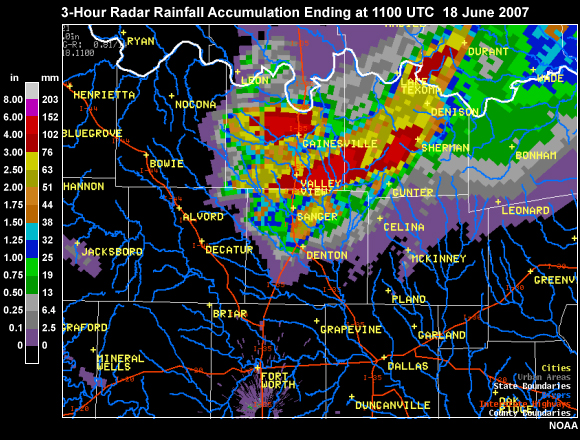
Precipitation accumulation is routinely derived from radar and satellite observations. Despite the inconsistencies in radar-derived precipitation from location to location and from season to season, radar guidance is considered superior to satellite guidance of QPE in many areas. This is mainly due to the superior resolution in both space and time and often better quantitative guidance.
Topics in this section include the relationship between drop size distribution, the Z-R relationship, and derived rainfall; the impact of snow on radar-derived estimates, the potential QPE improvement with polarimetric radar, radar coverage issues, and the concept of radar climatology. A brief summary of issues regarding satellite-derived QPE will follow the radar sections.
NOAA’s NWS Warning Decision Training Branch (WDTB) Distance Learning Operations Course (DLOC)
(http://www.wdtb.noaa.gov/courses/dloc/outline.html)
- Precipitation Estimation from radar (http://www.wdtb.noaa.gov/courses/dloc/topic3/lesson6/player.html)
The topics in this section cover some complex issues but we will only summarize them. More detailed training exists in NOAA’s WDTB online Distance Learning Operations Course (DLOC) referenced in section 1.
Reflectivity-Rainfall Rate (Z-R) and Drop Size Distribution (DSD)
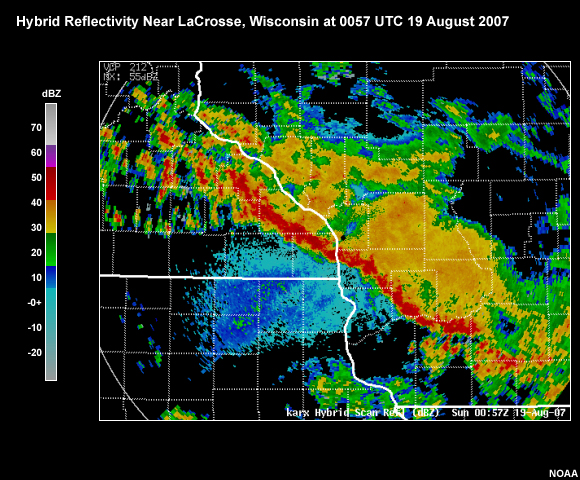
Radar reflectivity (Z), expressed in units of dBZ, is used to compute ...
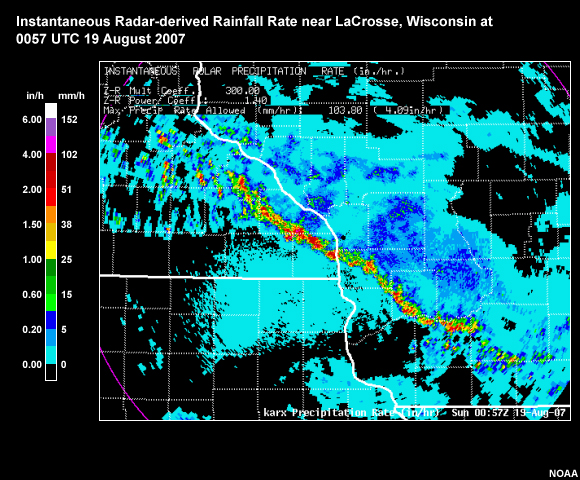
...rainfall rates (R) in mm/h using a reflectivity to rainfall rate relationship. This is known as the Z-R relationship.
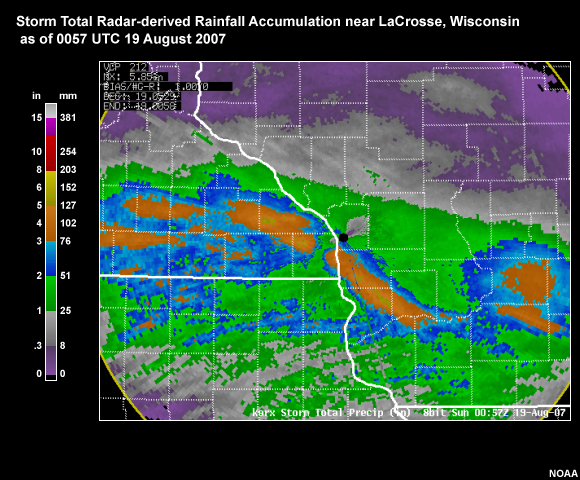
Rainfall rates then get integrated over time to produce accumulation for various time periods.
-
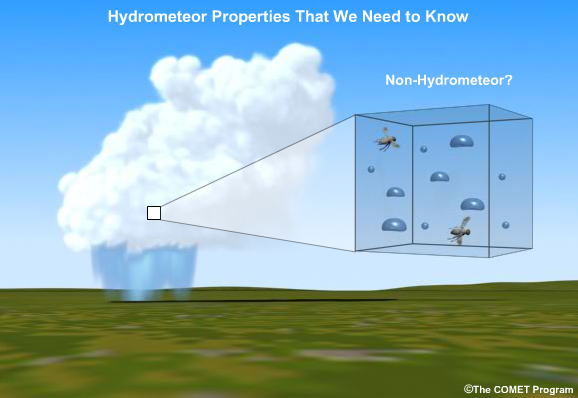
What size are the hydrometeors?
-
How densely are they packed together?
-
Are they liquid or ice?
-
Are there non-hydrometeors returning energy to the radar, like insects or ground targets?
-
Is the radar sampling a region that is representative of the precipitation reaching the ground?
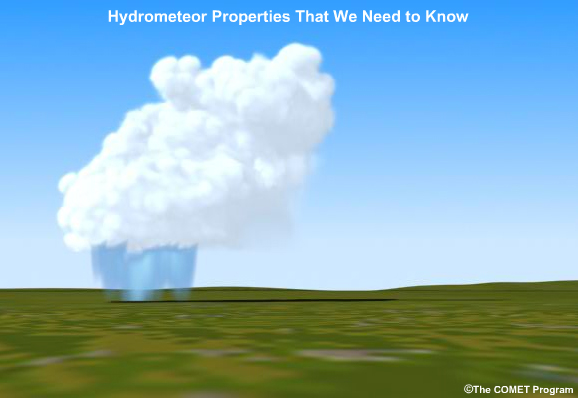
The relationship between reflectivity and rainfall rate, and thus the Z-R relationship, varies with time, location, and season. Hydrometeor properties that influence the Z-R relationship include:
The sizes...

The concentration...

And the phase.
Accuracy of derived rainfall rates is further impacted by:
The presence of non-hydrometeors...
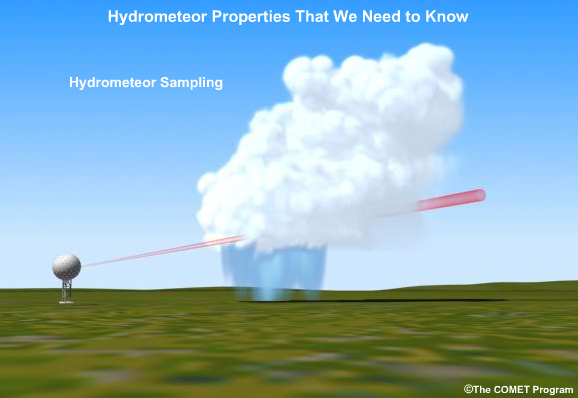
And whether the radar is sampling a region that is representative of precipitation reaching the ground.
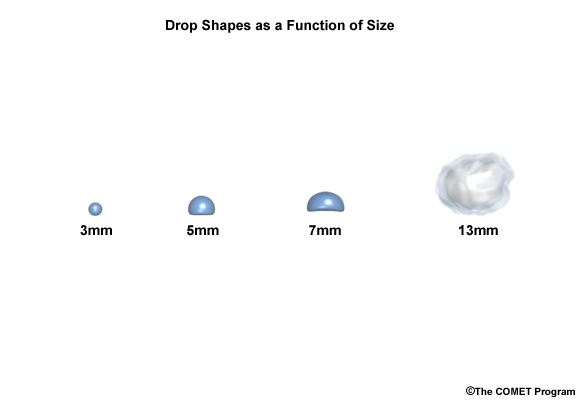
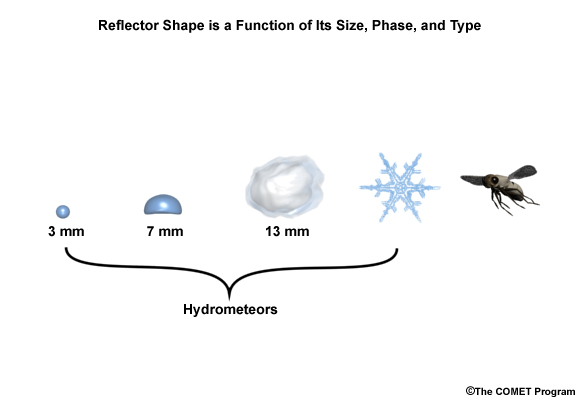
Hydrometeor shape, which is related to hydrometeor size and phase, is also important information for understanding
the relationship between reflectivity and precipitation rates. Large liquid drops are more oblate in shape
than smaller ones. For horizontally-polarized radars like the WSR88-D, greater horizontal diameters reflect
more energy back to the radar. This results in greater derived rainfall rates.
Even relatively small 13-mm (half-inch) diameter hailstones contribute greatly to radar reflectivity. That’s
why the presence of hail results in anomalously high derived-rainfall rates. This anomaly is typically
minimized through use of rainfall rate thresholds.
In Depth: Reflectivity Factor, Z
Z = ∫ N(D) D6 dD
Z = reflectivity factor
D = drop diameter
N(D) = number of drops of given
diameter per cubic meter
In the WDTB lesson on precipitation estimation from radar
(http://www.wdtb.noaa.gov/courses/dloc/topic3/lesson6/player.html)
this equation is presented to explain the sensitivity of reflectivity factor, Z, to drop diameter. Because
the drop diameter is raised to the 6th power, small changes in drop diameter result in very large changes
to Z. And large changes to Z result in large changes to derived rainfall rates.
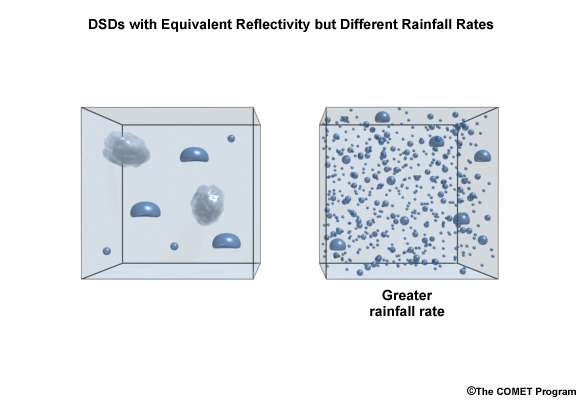
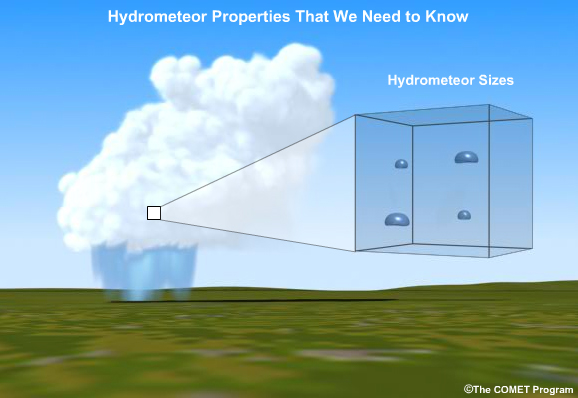
Drop size distribution (DSD) refers to the size and concentration of drops in a volume, say a cubic meter. Here we show two DSDs.
The radar is more sensitive to the horizontal diameter of the hydrometeors than it is to the concentration of hydrometeors. Therefore, a small number of large hydrometeors can result in the same reflectivity value as a very large number of smaller drops. But the DSD on the right is producing greater rainfall rates. The two DSDs should therefore be represented by different Z-R relationships.
-
DSD can vary quickly and significantly
-
May need more than one Z-R relationship
-
Z-R relationship may need to change with time
The DSD can vary significantly and quickly in both space and time. This means that it may be appropriate to have more than one Z-R relationship in effect at the same time. As of this writing, the NOAA National Mosaic and Multisensor QPE (NMQ) radar precipitation product can utilize numerous Z-R relationships based on atmospheric conditions.
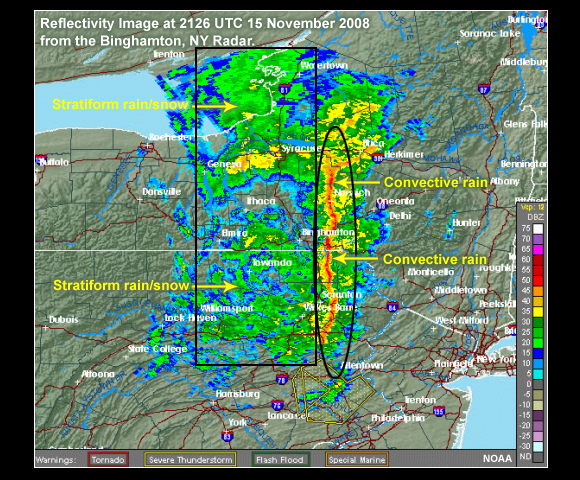
Here we have a region with a squall line that most likely has a DSD consistent with convective rainfall. Nearby stratiform precipitation will exhibit a different DSD and should be associated with a different Z-R relationship than the convective area. As the precipitation system moves, the Z-R relationship at any one location should change with time.
Reflectivity and Snow
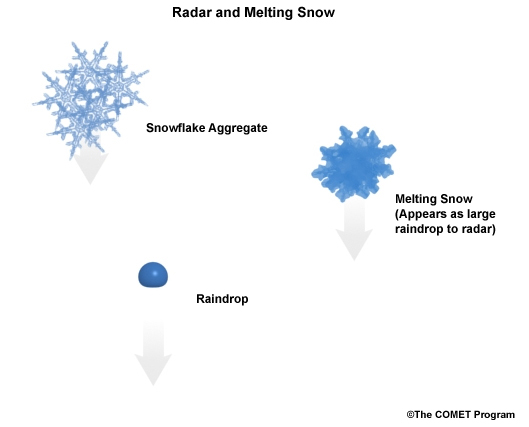
As snowflakes begin to melt, a coating of water can make them “appear” as very large raindrops to the radar. This can cause very high reflectivity and overestimated rainfall rates at the ground below where the radar is sampling the melting layer aloft.
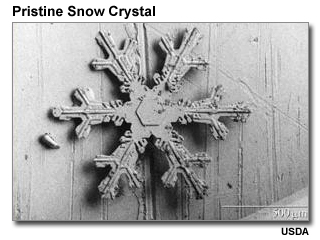
Pure snowflakes and crystals violate the assumption of liquid hydrometeors that go into the Z-R equation. However, several research institutions are working on radar-derived snowfall including Z-S, or reflectivity snowfall rate relationships. More information can be found from the NOAA/WDTB lesson on radar-derived snowfall:
Topic 5, Lesson 24: Snowfall Accumulation Products: http://www.wdtb.noaa.gov/courses/dloc/topic5/Lesson23/player.html
Precipitation Estimates with Dual Polarimetric Radar
Dual-polarized, or polarimetric radar
-
Very promising for more accurate precipitation estimation
-
Help eliminate errors associate with uncertainties in drop size, distribution, and phase
Advances are made in radar technology every year. As this lesson is being developed the most promising with respect to precipitation is dual polarized radar, or polarimetric radar.
A network of polarimetric radars promises to alleviate some of the errors associated with the phase, size, and distribution of hydrometeors. Ultimately, this means the problems associated with inappropriate Z-R conversions should be minimized.
-
Excellent online training:
http://www.wdtb.noaa.gov/modules/dualpol/
Excellent training on precipitation measurement using polarimetric radar is available from NOAA’s WDTB. We will not repeat those lessons here, but we strongly encourage you to review them.
Polarimetric radar:
-
Provides estimate of hydrometeor shapes
-
Uses both horizontally and vertically polarized radar beam
-
Measures the effects of hydrometeor shape
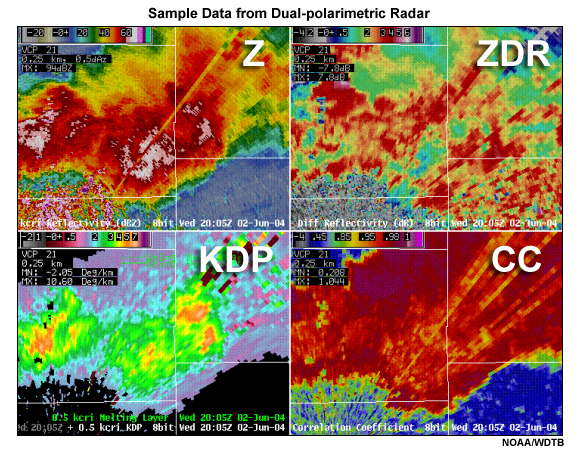
The basic premise behind polarimetric radar is that in addition to reflectivity estimates that we are familiar with, it estimates the shapes of hydrometeors. This is accomplished by using both a horizontally and a vertically polarized radar beam. By measuring the different returns from these two polarizations, one can estimate the shape and the effects from different hydrometeor shapes.
For example, we can determine if the prominent reflectors are large raindrops, which tend to be oblate with a large horizontal axis. We can also determine if the hydrometeors are more spherical, consistent with small raindrops. Or we can measure if the hydrometeors are highly reflective and generally spherical, consistent with hail. Other measures can be used to estimate the presence of snow, insects, or ground targets.
Radar Sampling of Precipitation
Good radar coverage requires:
-
No obstructions from terrain and buildings
-
Deep precipitating systems such as convection
-
Good density; radars are close together

There are no obstructions of the low-level radar beam from terrain features or other ground targets like buildings.
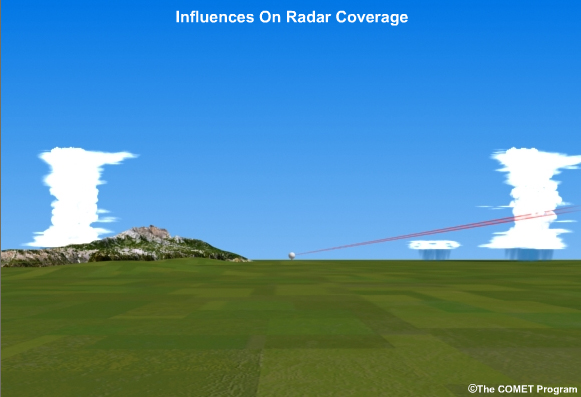
Precipitation systems extend through a deep portion of the troposphere, as we see with convective storms.
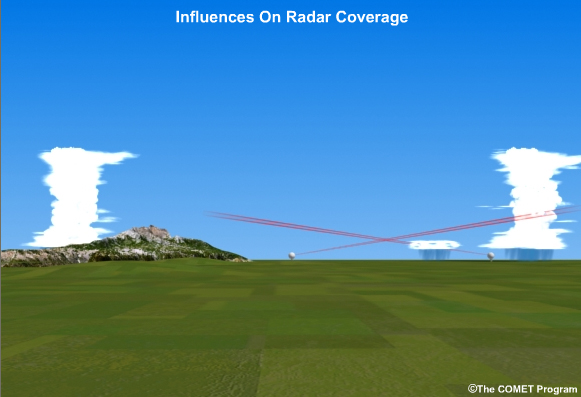
The density of radar sites is sufficient. In other words, the radars are close enough to each other so that all radar sampling is occurring in the low levels of the atmosphere.
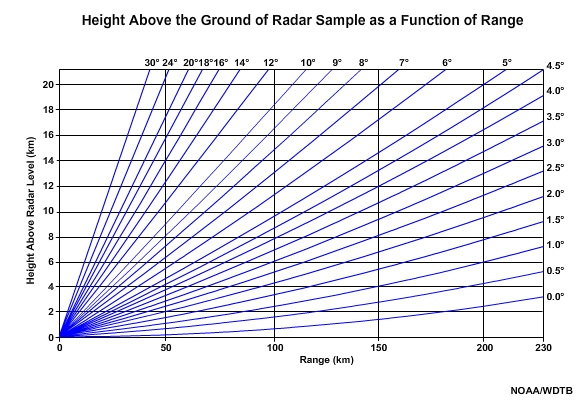
The radar beam gets higher in the atmosphere with distance from the radar. Even a low tilt angle like 0.5° is ~1.5 km (5,000 ft) above the ground at 100 km from the radar, and 5.2 km (17,000 ft) high at 230 km. Therefore, to sample the low-level precipitation, which is most likely to be representative of the precipitation reaching the ground, radars need to be close to each other.
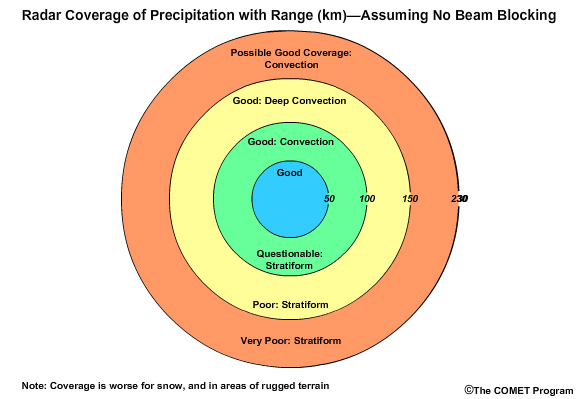
For Stratiform:
-
Sample lowest 1 km
-
Must be close to radar
-
Very limited in rugged terrain
For Convection:
-
Distributed through a deep atmospheric layer
-
Often well sampled out to 150 km or more
For stratiform precipitation it is best to sample the lowest 1 km of the atmosphere which typically occurs within 50 km of the radar. Beyond 50 km the radar sample may be questionable. This range can be limited further by terrain blocking of the radar beam. Sampling of stratiform precipitation is almost always poor beyond 100 km from the radar.
Convective precipitation is distributed over a much deeper layer of the atmosphere than stratiform precipitation. Therefore,
in seasons and locations where convection is common and terrain is minimal, the radar may be able to sample
precipitation well at long distance from the radar, perhaps beyond 150 km. Shallow convection may
be undersampled by the radar at closer ranges than 150 km.
Range coverage is worse for snow.
Radar Coverage
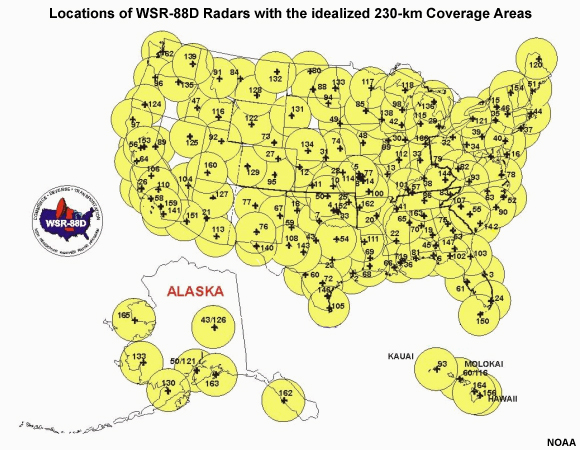
Here are the NWS radar locations with the ideal 230-km range shown with yellow circles. The density of weather radars is generally lower in the western United States and Alaska than in other parts of the country. These maps do not account for terrain features that can greatly reduce the radar coverage.
For many locations and precipitation regimes, it’s unrealistic to expect good precipitation estimates with the ideal 230-km coverage shown here. A more realistic radius of 100 or 150-km would show bigger and more numerous gaps, especially in the Western United States. In the winter, the range of realistic coverage may shrink to less than a 100 km radius.
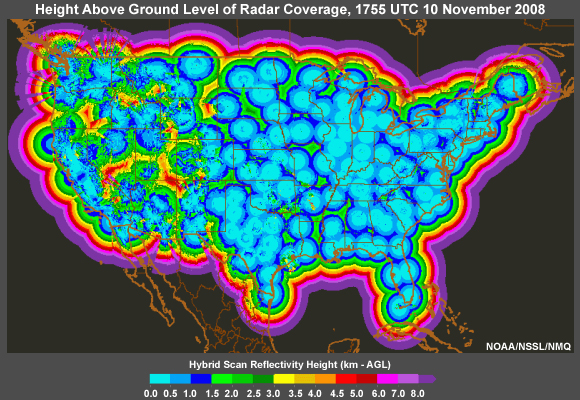
A more realistic coverage is shown here with a map of the height above ground level (AGL) of the radar sampling. It is for November 10th, 2008. Although this map can change depending on weather conditions and radar operations, the basic pattern will be the same.
The light blues show where there is good coverage of the low levels. The best low level coverage is obviously in areas with relatively flat terrain and good radar density. Recall that for stratiform precipitation, radar coverage can be significantly impacted if the radar sampling is 1 km or more above the ground as shown in the dark blue, greens, yellows, and reds. Even in the central and eastern U.S., stratiform precipitation may be significantly underestimated in places. In the West, radar sampling can be more than 3 km above the ground in large areas. This results in completely missing precipitation systems, especially stratiform. This is also a problem in Alaska. As an example let’s look more closely at radar coverage in the northwestern portion of the contiguous United States.
Radar Climatology
Good Coverage
-
Radar is able to sample precipitation
-
Radar sample is from lowest possible elevation
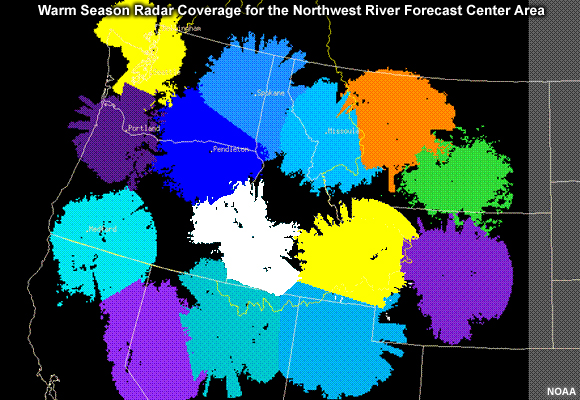
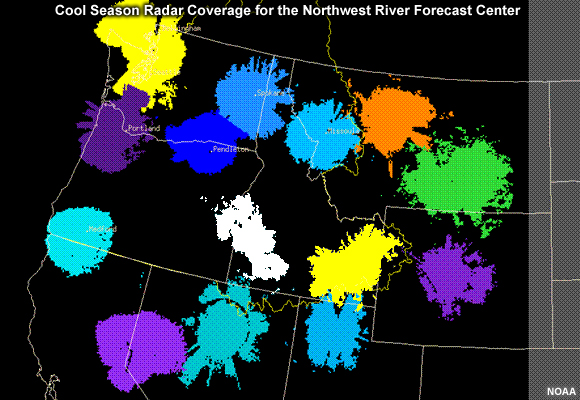
To account for the geographic and seasonal variability, the NWS has radar coverage maps. Here we see the
warm-season effective radar coverage for the Northwest. The color-shaded areas are where radar climatology
shows good coverage from at least one radar. The individual colors depict which radar the “good” coverage
will come from. For example, this white area shows where radar estimates would come from the radar at Boise,
Idaho, KCBX. KCBX is considered good here because 1) that radar is able to sample precipitation, and 2)
in areas of overlap with neighboring radars, KCBX is sampling from a lower elevation.
The jagged appearance is caused by mountains preventing uniform good coverage throughout the entire 230-km
radius.
http://www.nws.noaa.gov/oh/hrl/papers/2001mou/chapter3_app.pdf
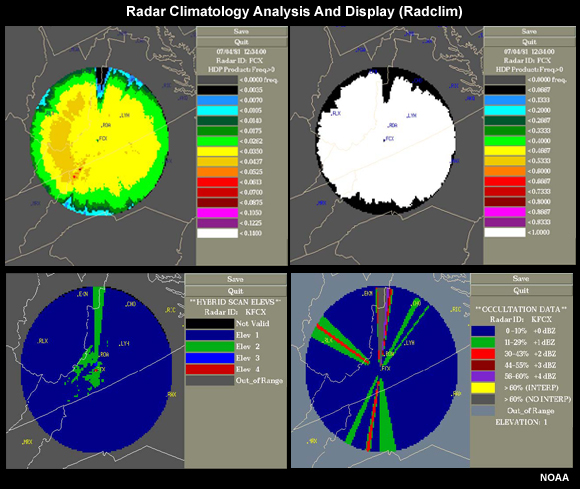
These are produced by the NWS radar climatology program, RADCLIM. We will briefly demonstrate radar climatology based on frequency of occurrence of precipitation for Boise, Idaho.
-
Precipitation threshold > 0.00 mm
-
Frequency of occurrence of precipitation for each radar bin
-
# times more than 0.00 mm detected
-
Divided by all zero and non-zero radar observations
-
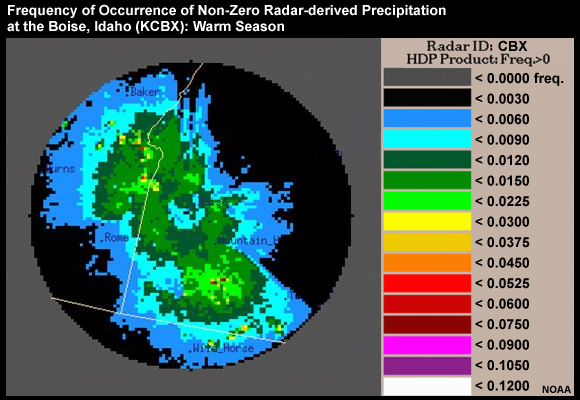
The precipitation frequency of occurrence starts with a precipitation threshold for defining what we will
consider precipitation. Let’s use a threshold of 0.0 mm which means that any time there is more than
0.0 mm detected by the radar, we have a precipitation event. We could choose a higher threshold if
we want to filter out light events.
The frequency of precipitation, for each radar bin, is the number of times more than 0.0 mm was observed
divided by all of the radar observations in the data set. We get this image for the Boise radar.
The radar is in the center of the 230-km radius of ideal radar coverage.
The different colors show the different frequencies of occurrence. As distance increases from the radar the frequency of precipitation decreases, indicated by blue and black colors. Note the large areas with very low frequencies of occurrence, seen as black. These do not represent natural precipitation distribution. Rather, it shows where the radar sampling is greatly inhibited by terrain blocking.
Radar Coverage Map
-
Choose precipitation frequency threshold:
“Only when precipitation occurred this often, will we trust the radar"
So now we want to choose a precipitation frequency threshold to represent effective radar coverage. In other words, we will say, “only when precipitation occurred at least this often, will we trust the radar estimates.”
In this example, a frequency of occurrence of 0.006 was chosen. This means that we will only consider radar bins where greater than 0.0 mm occurred at least 0.006, or 0.6% of the time according to the radar climatology.
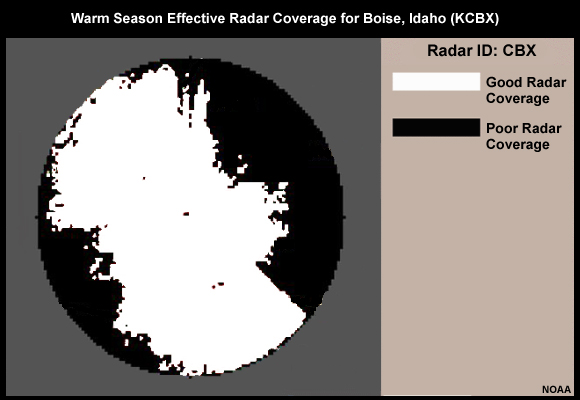
This is all non-black shaded areas shown on the radar coverage map as white shading. So the white shading is where we assume good radar coverage. We should assume bad coverage in the black areas. In the black areas, precipitation estimates should come from other radars or other sources such as rain gauges and satellite.
The choice of frequency threshold is somewhat subjective, based on forecaster experience regarding what produces the most useful guidance.
Radar climatologies are generated for specific months or seasons. Let’s go back to the summer season radar coverage for the northwestern portion of the contiguous United States. All of the non-black areas are where we can assume good radar coverage. Again, here is the Boise coverage area that we just talked about. So the white shading is where we can assume good coverage.
In the cool season, there is more low level precipitation and thus the effects of terrain and distance on radar precipitation estimates are more severe.
So let’s look at a radar coverage map for the Northwest in the cool season. Note the sharp decrease in good radar coverage.
These types of radar coverage maps, based on radar climatology, are used in MPE to determine where radar-derived data should be used.
Satellite QPE
Satellite estimation of precipitation is potentially useful in areas with poor coverage from radars and rain gauges. Although satellite sampling is more consistent from place to place than radar sampling, satellite-derived precipitation is lower resolution and generally less accurate than radar-derived precipitation. It is therefore considered a supplement, not a replacement for the radar products.
-
Perform best in tropics and middle latitude warm season
-
Terrain enhancement helps with spatial resolution of precipitation
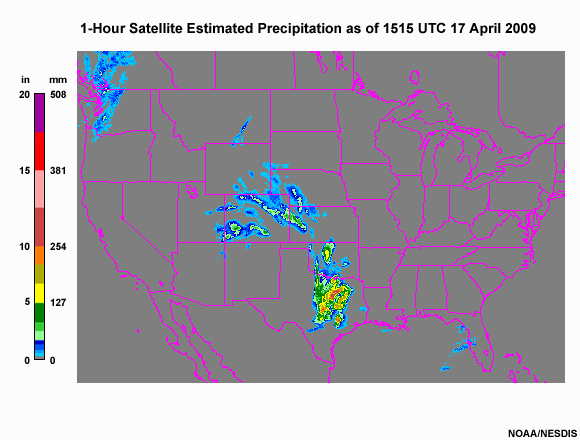
For satellite Hydro-Estimator rainfall products:
http://www.star.nesdis.noaa.gov/smcd/emb/ff/auto.html
Satellite-derived rainfall products perform best in the tropics and in the middle latitudes during the warm season. In other words it verifies best when the wind shear is relatively low and precipitation is dominated by convection. These are not the conditions in the radar-sparse western United States during the wintertime wet season.
This NOAA product known as the hydro-estimator applies a terrain factor to the precipitation estimate using 700 mb winds. This helps with resolving the spatial distribution of the precipitation. Other improvements to precipitation rates may be achieved by applying factors related to cloud, moisture, and stability characteristics.
In addition to adjustments based on both measured and modeled environmental properties, there is increasing
use of additional sensor capabilities such as microwave satellite sensing and lightning detection. Passive
microwave observations allow detection of water and ice within the cloud for derivation of more accurate
rainfall rates. However, because microwave sensing capabilities are specific to polar-orbiting satellites,
the temporal frequency is much less than that of the hydro-estimator products based on geostationary satellites.
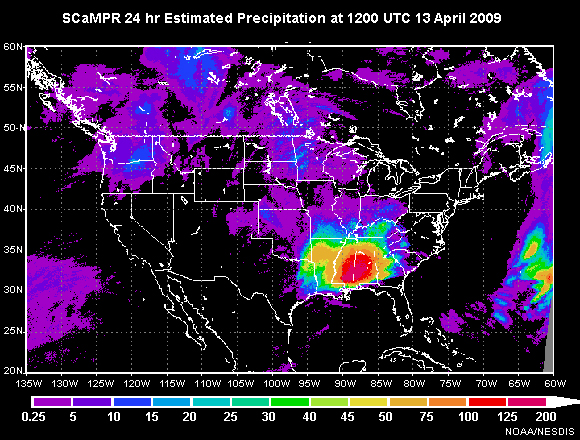
The SCaMPR product, (which stands for Self-Calibrating Mutivariate Precipitation Retrieval) is an example
of combining the temporal resolution of geostationary satellites with the more accurate estimation of rainfall
rates of polar orbiters, and previews the next generation of operational satellite-based precipitation
estimation tools.
NOAA’s Flash Flood Home Page:
http://www.star.nesdis.noaa.gov/smcd/emb/ff/index.html
For more information on efforts pertaining to real time satellite-based precipitation estimation at NOAA, please see NOAA’s Flash Flood Home Page.
“Microwave Remote Sensing: Clouds, Precipitation, and Water Vapor”
http://www.meted.ucar.edu/npoess/microwave_topics/clouds_precip_water_vapor/
For more information about ongoing efforts to develop synergistic precipitation products which combine the accuracy of microwave products with the temporal advantages of geostationary observations, please see the COMET module entitled “Microwave Remote Sensing: Clouds, Precipitation, and Water Vapor”.
Future multi-satellite precipitation products will also benefit from the new constellation of polar-orbiting satellites, known as the GPM, or Global Precipitation Measurement mission.
Remote Sensing QPE Key Points
-
Radar data provide best resolution
-
Best radar coverage:
-
Convective precipitation
-
Liquid precipitation
-
Minimal terrain features
-
-
Errors in radar-derived precipitation:
-
Variations in drop size distributions
-
Precipitation phase
-
Lack of low-level information
-
-
Dual-polarized radar:
-
Estimates hydrometeor shapes
-
Promises more accurate precipitation products
-
-
Satellite-derived precipitation supplements regions with poor radar and rain gauge coverage
Review Questions
1. The greatest advantage of radar-derived rainfall estimates is their _____.
Choose the best answer.
The correct answer is b.
2. Radar precipitation estimates are likely to be most accurate for _____.
Choose all that apply.
The correct answers are a, b, and c.
3. Which of the following is least necessary for good radar coverage?
Choose the best answer.
The correct answer is a.
4. An appropriate Z-R relationship _____.
Choose all that apply.
The correct answers are a and d.
5. Polarimetric radar should provide a means to more accurately estimate the drop size distribution resulting in better precipitation estimates.
Choose the best answer.
The correct answer is a.
6. Satellite-derived rainfall is more consistent but less representative than radar in the conterminous U.S.
Choose the best answer.
The correct answer is a.
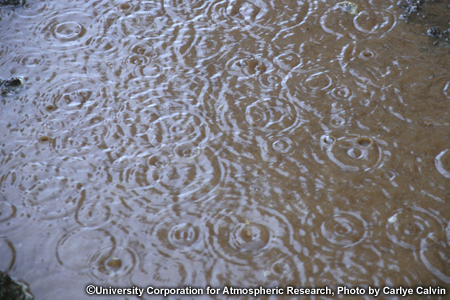
Rain Gauge QPE
As long as humans have kept weather records there has been a need to capture precipitation in some sort of collection device.
Today’s precipitation gauges, hereafter referred to as rain gauges, are the current version of those collection devices.
Rain gauges come in a variety of styles, both manual and automated...
and are used to measure rain as well as the liquid equivalent of frozen precipitation.
Topics in the section include:
-
The truth behind ground truth
-
The impact of wind
-
The impact of gauge characteristics and location
-
Issues with automated gauges
-
Issues with manual gauges
In this section we will discuss the reality of the term “ground truth”. In doing so we will discuss the impact on gauge measurement, or “gauge catch,” from wind, the physical characteristics and location of the gauge, and the characteristics of the precipitation. We will offer some perspective on these issues with respect to whether the gauge is automated or manual.
Are they really ground truth?
http://www.meted.ucar.edu/qpf/rgauge/
COMET has a webcast called, Rain Gauges, Are They Really Ground Truth? Produced in 2001, it features Colorado state climatologist and national rain gauge expert, Nolan Doesken. We will summarize the main points here, but you are encouraged to refer to the webcast for more detail.
Ground truth?
-
Often provide excellent point measurements
-
At times, errors are quite large
Sources of error:
-
Construction of the gauge
-
Exposure of the gauge
-
Character of the precipitation
-
Weather conditions
Often referred to as “ground truth”, rain gauges are subject to errors from a variety of sources. Although gauges do often provide excellent point measurements, at times the error in those measurements can become quite large. Sources of error include the construction and exposure of the gauge itself, character of the precipitation, and the weather conditions.
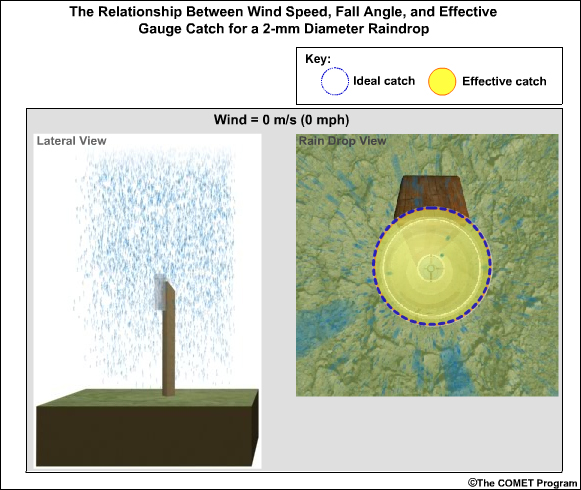
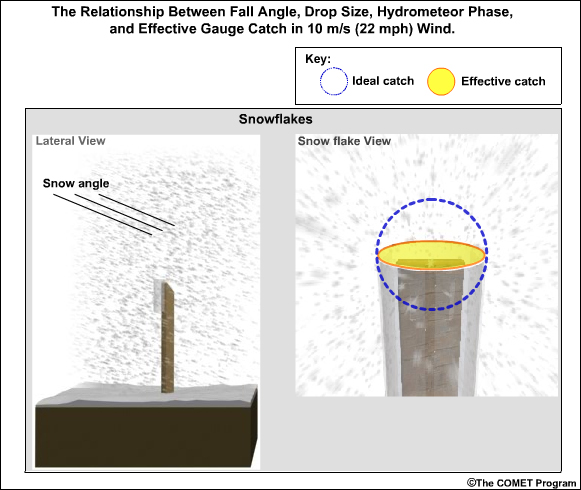
Exercise: Gauges, Wind, and Fall Angle
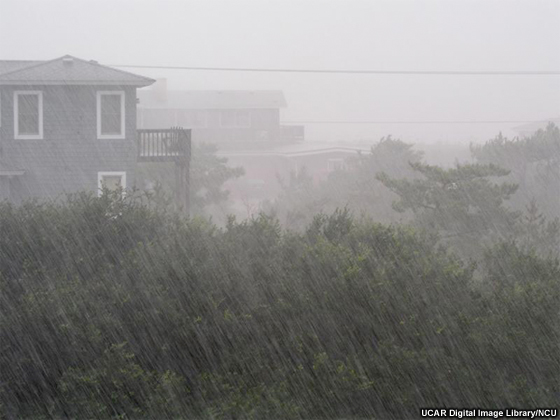
In still air the hydrometeors that make up precipitation fall vertically downward to the gauge.
Wind causes precipitation to fall at an angle with respect to the vertical. In addition, the gauge itself presents an obstacle to the flow. This results in altered wind patterns near the gauge.
Click above image to open video in new window.
The effects of the wind will vary depending on hydrometeor phase and size.
-
No wind: precipitation falls vertically downward
-
Wind causes precipitation to fall at an angle
-
Wind causes altered wind patterns near gauge
-
Wind effects vary with hydrometeor phase and size
In this exercise we will consider typical 2mm-diameter raindrop. We will take the perspective of 2-mm drops falling toward the gauge opening. Consider a 0° fall angle to be that of rain falling perfectly vertical, and a 90° fall angle is rain blowing perpendicular to the gauge.
Compare how the fall angle changes in the following figures, along with the effective collection area of the gauge, as wind speed changes. For each wind speed you can compare the ideal catch area of the gauge with the effective catch area that is determined by the fall angle. When you are ready, answer the questions provided.
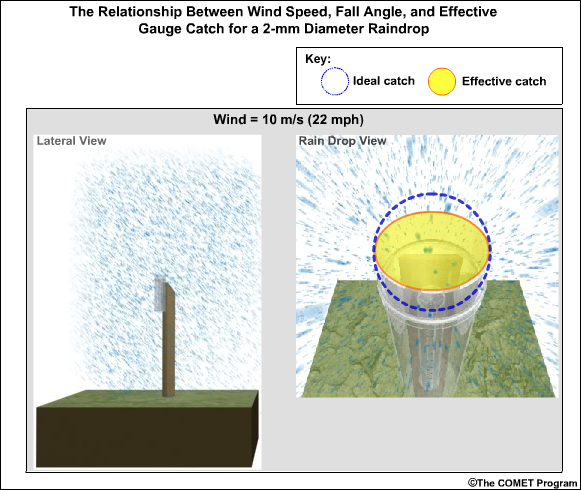
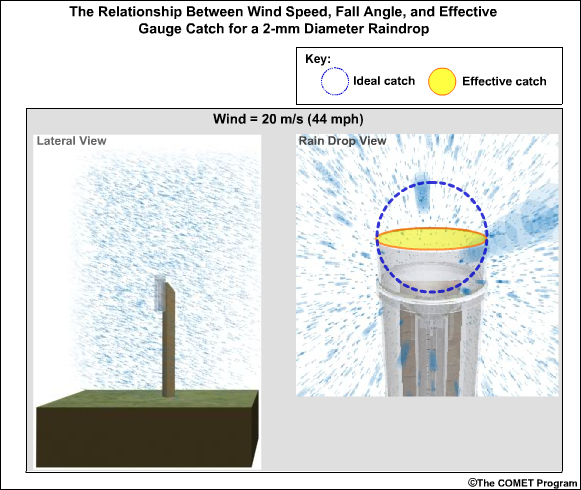
Questions:
1. As the wind speed increases, the effective “catch” area of the gauge opening _____.
Choose the best answer.
The correct answer is a.
2. At a steady wind speed of 20 m/s (44 mph), the effective collection area of the gauge appears to be _____ the ideal catch area.
Choose the best answer.
The correct answer is c.
Of course there is a great deal of variability controlling the fall angle. Influences on the angle include the steadiness of the wind, disruption to the flow, and very importantly, the size and phase of the hydrometeor.
Continuing with the perspective of raindrops falling toward the gauge opening, let’s hold the wind speed at a steady 10 m/s (22 mph). Compare how the gauge catch for 2-mm drops changes for drops of >3 mm diameter, smaller drops of <1 mm diameter, and pristine snowflakes.
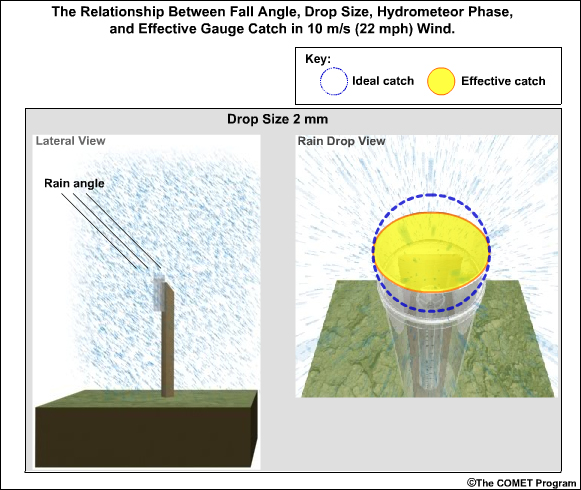
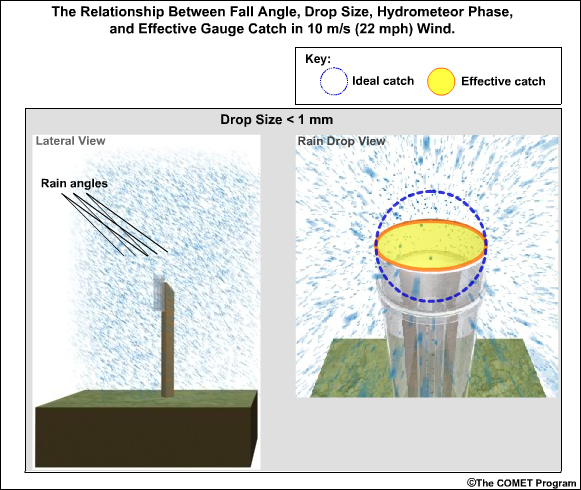
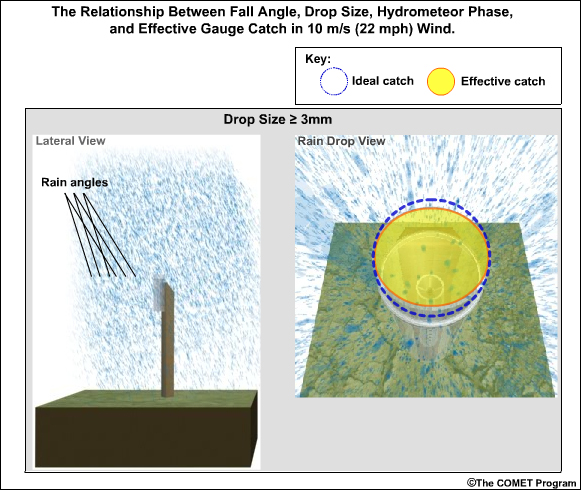
Questions:
1. Which is likely to have the greatest undercatch by the gauge?
Choose the best answer.
The correct answer is a.
2. Which is likely to have the second greatest undercatch by the gauge?
Choose the best answer.
The correct answer is d.
3. If a rainfall had a mixture of 1-, 2-, 4-mm drops, which ones would be best sampled by the gauge?
Choose the best answer.
The correct answer is c.
4. If we had wet snowflakes instead of pristine snowflakes, we should expect the gauge catch to be _____.
Choose the best answer.
The correct answer is a.
Gauges, Wind, and Turbulence
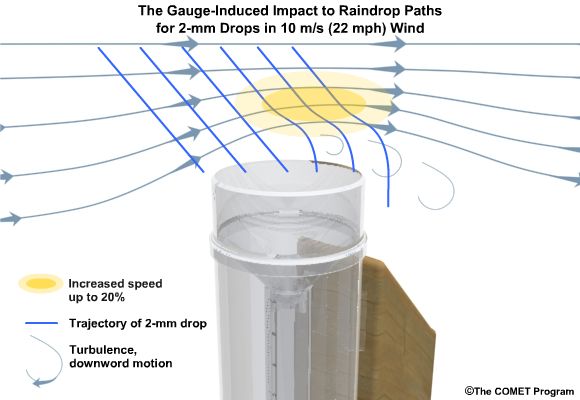
The fall angle considerations represent a realistic worst-case scenario for elevated and highly exposed gauges. But in addition to fall angle considerations, turbulence in the flow may influence the trajectory of the hydrometeors. This may partially offset errors caused by the wind.
Here we see an increase in wind speed over the gauge, but we also see turbulence- induced downward motion. Note from the trajectories that this may increase catch, although sometimes the primary gauge-induced downward motion may be downwind of the gauge.
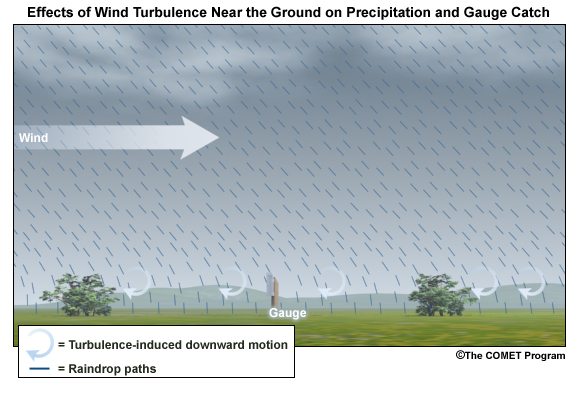
Ground-induced turbulence in the vicinity of the gauge may be much more important for improving gauge catch than turbulence induced by the gauge itself.
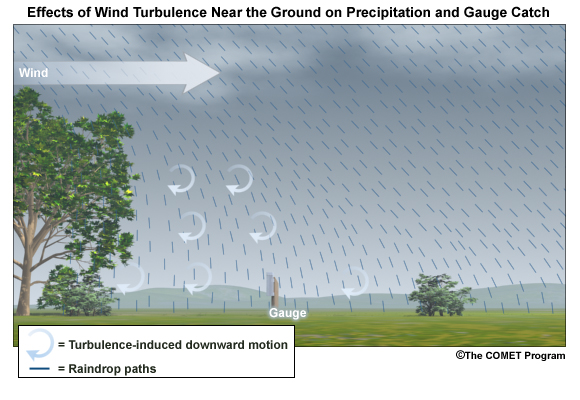
As long as the ground objects are not tall enough to intercept incoming precipitation, the turbulence-induced downward motion has the effect of turning the hydrometeors vertically toward the ground.
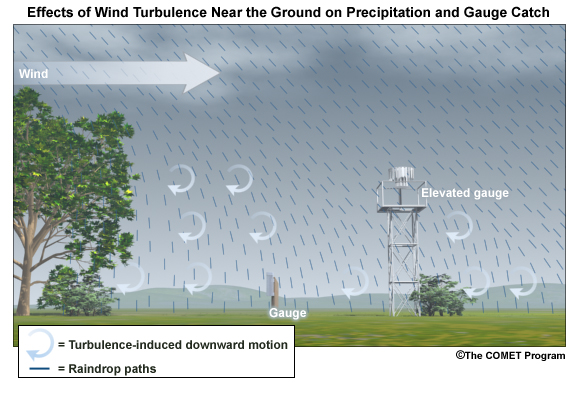
Elevated gauges are less likely to benefit from ground-induced turbulence.
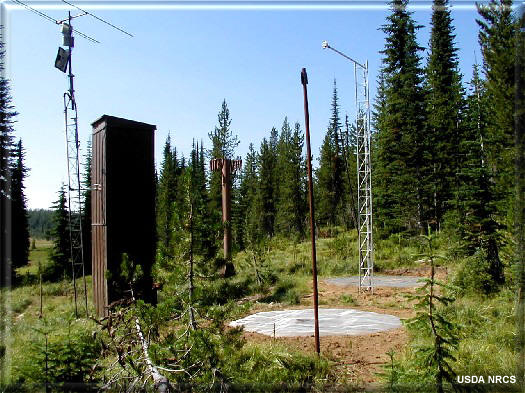
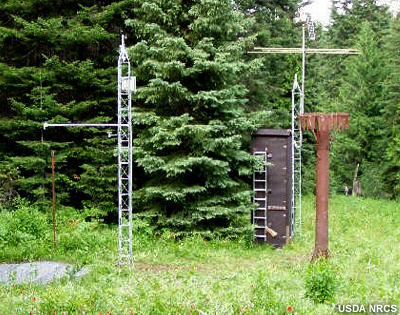
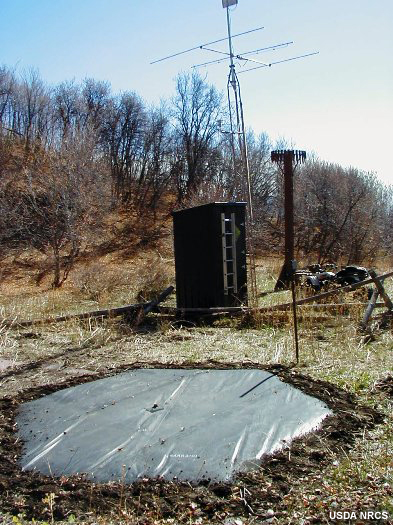
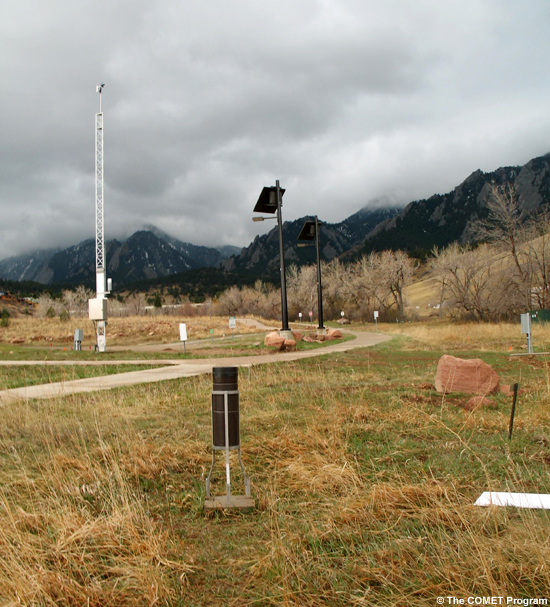
A clearing within the trees may provide the best balance between reducing wind speed but not altering precipitation distribution too much. Remember that the effects from deciduous trees are seasonal.
(Note: This measurement station also includes a snow pillow used to measure the weight of accumulated snow. Snow pillows will be discussed in more detail later. )
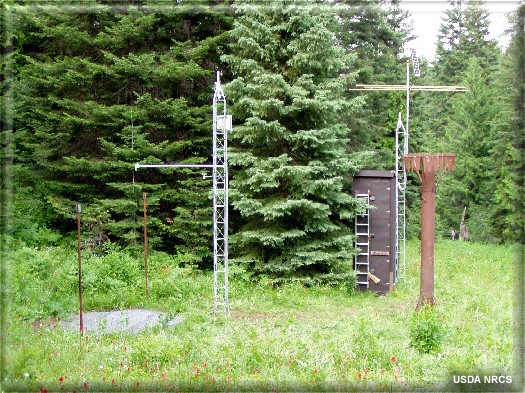
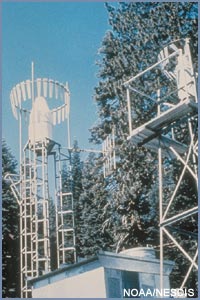
Photo A
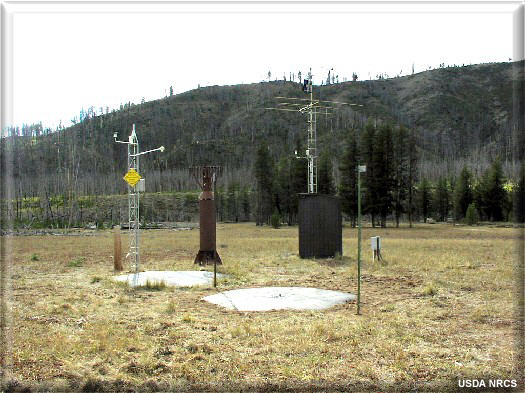
Photo B
Question: Which gauge is likely to suffer less from wind-induced undercatch?
Choose the best answer.
The correct answer is a.
The gauge in photo A at Mica Creek, Idaho is less likely to experience significant wind-induced undercatch because it is in a less exposed location than the gauge in photo B. Clearings in forests are relatively good locations for gauges because the lower wind speed and turbulence between the surface and roughly the height of the trees induces downward motion of the hydrometeors.
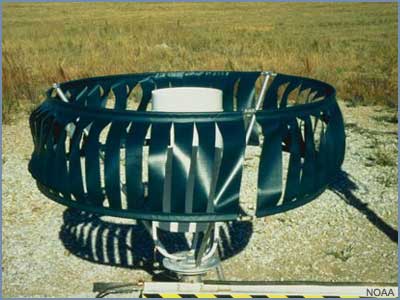
Although vegetation may provide natural barriers to generate turbulence-induced downward motion, wind shields are often constructed to specifically induce this effect. Although these may result in some improvement, considerable wind-induced error may still exist.
Question:
Considering turbulence effects, which two gauges do you think would result in better gauge catch?
Choose the two best answers.
The correct answers are a and d.
Rain, Gauge Catch, and Wind
In summary, gauge catch of rain is influenced by both the fall angle and the turbulence in the vicinity of the gauge.
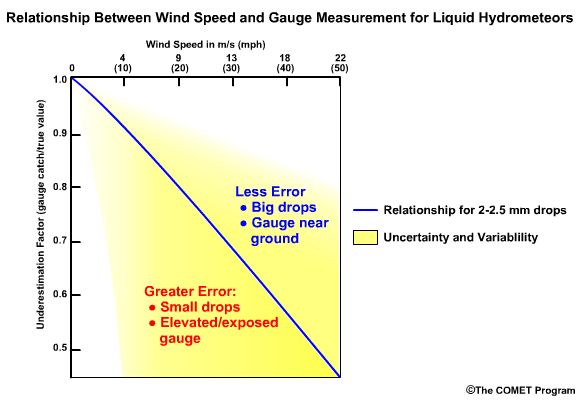
This graphic shows the generalized relationship between wind speed and gauge catch for liquid hydrometeors. The gauge catch is expressed as the ratio of the gauge measurement to what actually fell, so values less than 1.0 are measures of underestimation by the gauge.
-
Rule of thumb: 1% loss for every 1 mph increase in wind speed, or 2.2% for every 1 m/s increase
-
Uncertainty associated with drop sizes & gauge location
-
Best measurements in windy conditions:
-
Large drops
-
Gauge near the ground
-
Shielded gauges
-
-
Poorest measurements
-
Small drops/drizzle drops
-
Elevated gauges
-
For a typical size raindrop of 2-2.5 mm, a general rule of thumb is to expect a 1% loss of precipitation for every 1 mph increment in wind speed. This converts to 2.2% for every 1 m/s.
Therefore, a 9 m/s (20 mph) wind speed may be expected to result in an underestimation factor of 0.80, or a 20% underestimation of the rainfall.
There is a large envelope of uncertainty due to the variability in drop sizes, the steadiness of the wind, and the gauge location. Here are a few main points to remember. The best measurements in windy conditions will be in situations with large raindrops, gauges near ground level, and shielded gauges. The poorest measurements will be with small raindrops and drizzle drops, and when gauges are directly exposed to the wind.
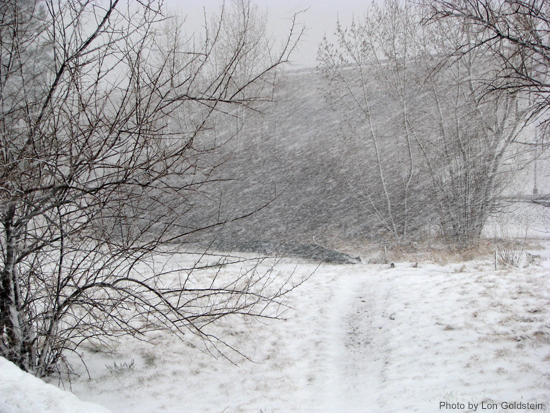
Snow, Gauge Catch, and Wind
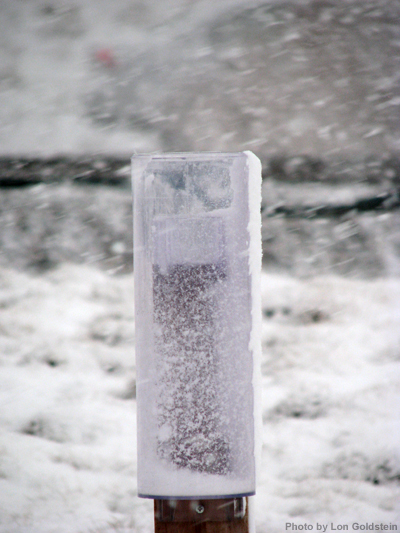
Click above image to open video in new window.
As demonstrated in the exercise, snow is more severely impacted by wind.
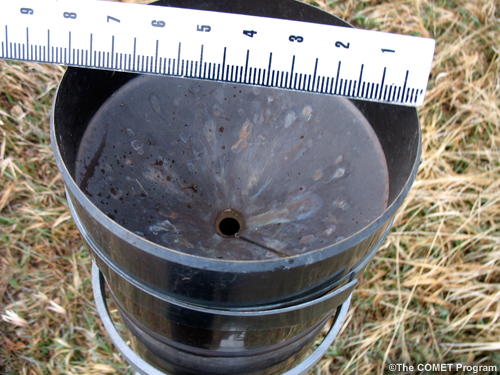
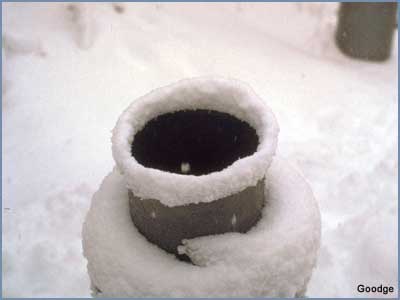
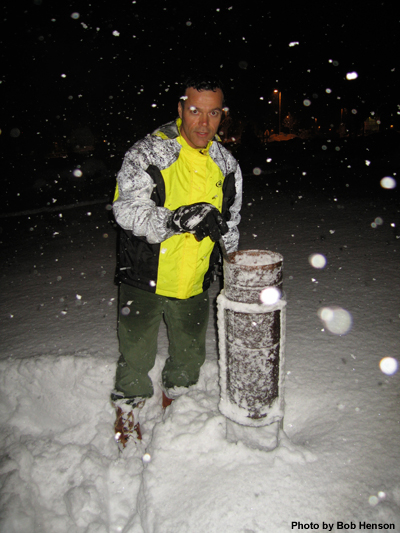
This photograph shows the typical collection of snow in a rain gauge with relatively light winds of 5 m/s (11 mph). The snow is drifted up on one side illustrating that only a portion of the opening, on the downwind side, was effectively collecting the snow.
A 5 m/s (11 mph) wind will result in gauge undercatch for snowflakes on the order of tens of percent.
The studies plotted on this graph show that at a wind speed of 7 m/s (15 mph) the gauge may be catching
only 10-50% of what actually falls! Even in the two studies where the gauge catch was improved through
use of wind shields, the gauge catch at 7 m/s is still 50% or less. The magnitude of the problem will vary
with snowflake characteristics.
Denser crystals will have less gauge catch errors than low density crystals.
Snow pillows are a technology used at SNOTEL sites in the western United States. These weigh the snow on the ground to get a liquid equivalent. Users in the NWS generally find that these data are superior to those provided by automated gauges.
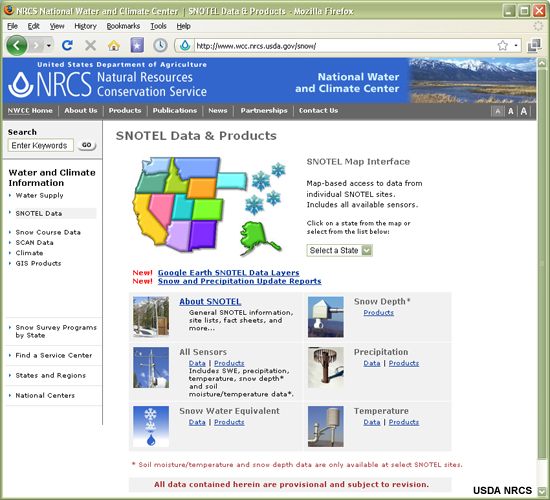
NRCS SNOTEL site: http://www.wcc.nrcs.usda.gov/snow/
More information can be found at the United States Department of Agriculture, Natural Resources Conservation Service (NRCS).
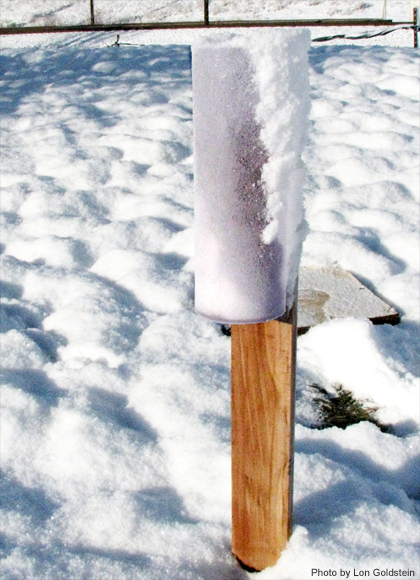
Effects from Gauge Characteristics
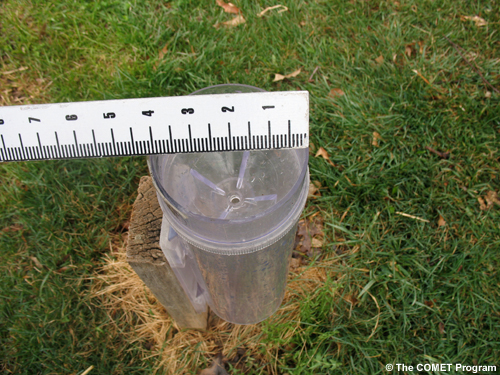
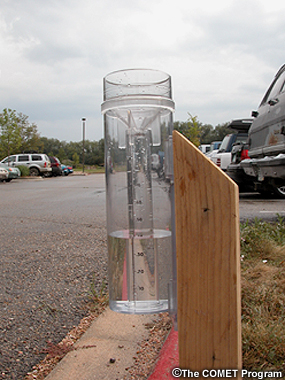
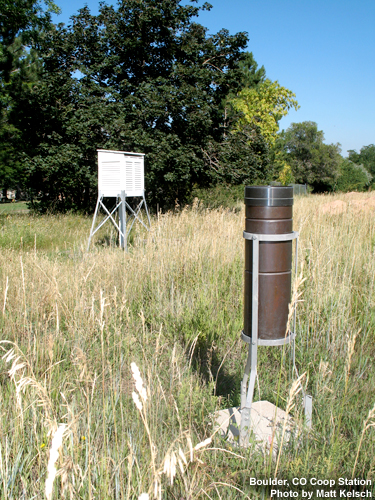
A gauge aperture of at least 102 mm (4 in) in diameter is desirable. These NOAA-approved clear plastic gauges have 4-inch diameter apertures. Smaller openings will increase the likelihood of under catch.
The NWS cooperative climate station manual gauges have a 203 mm (8 inch) aperture.
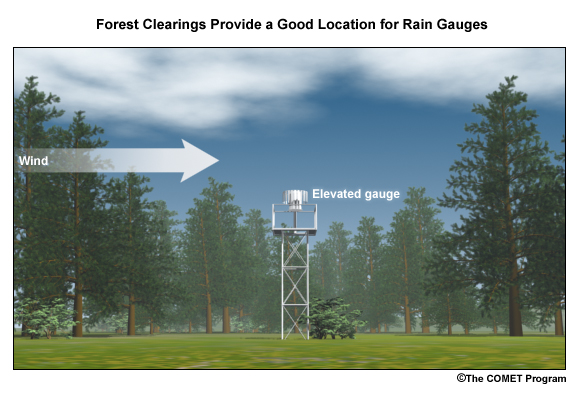
As mentioned earlier, gauge catch is sometimes improved when nearby vegetation disrupts the wind. A good location may be a forest clearing where the trees are not close enough to directly intercept the precipitation.
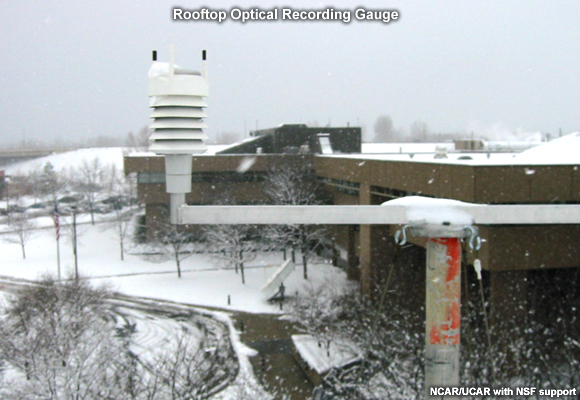
The reason to elevate gauges or place them on rooftops is often driven by security concerns rather than science. This increases the likelihood of wind-induced errors.
Measurements from Automated Gauges
Automated rain gauges are preferred by many professional users such as the NWS. Automation allows for the assimilation of numerous reports from remote regions.
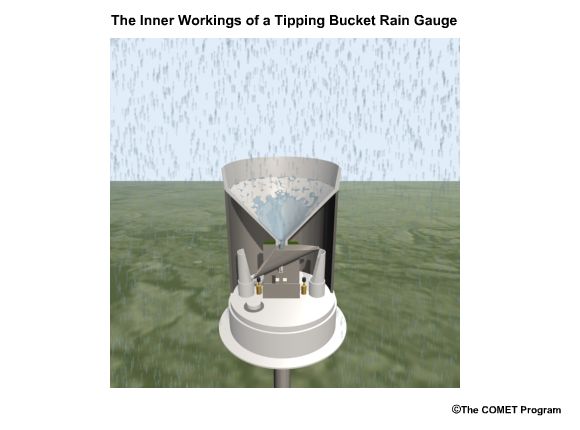
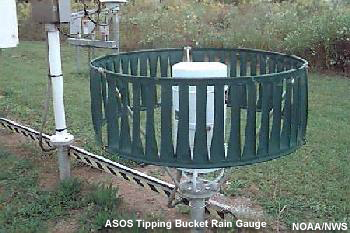
Click above figure to open animation in new window.
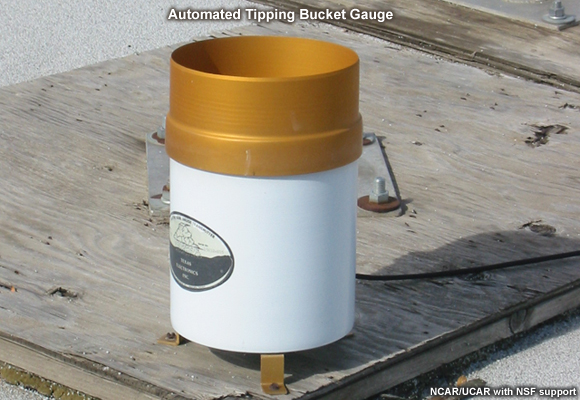
A widely used type of automated gauge in the United States is the tipping bucket style. These allow for high temporal resolution.
Problems associated automated gauges often a function of:
-
Precipitation rate
-
Precipitation phase
Problems associated with automated gauge measurements are often a function of precipitation rate and precipitation phase.
Precipitation phase refers to whether the hydrometeors are liquid...
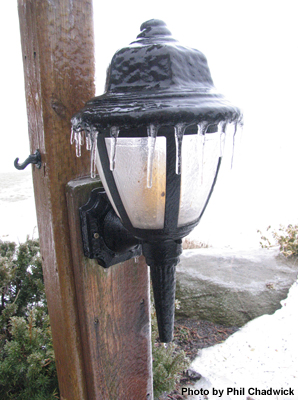
...liquid and below freezing—such as freezing rain—or ...
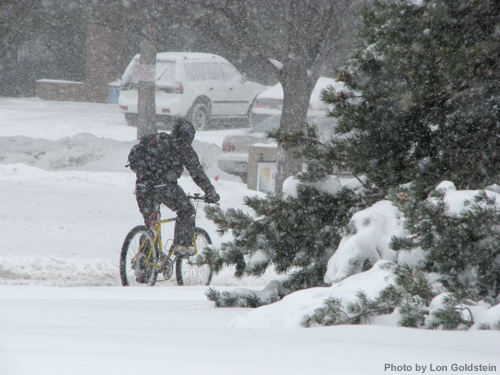
...frozen, such as hail or snow.
Click above figure to open animation in new window.
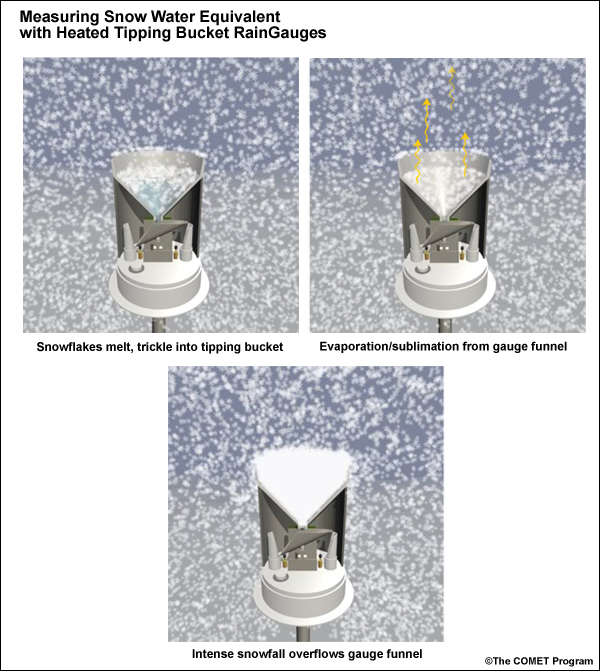
Automated tipping bucket gauge underestimation issues:
-
Must be heated to melt frozen precipitation
-
But heating leads to evaporation
-
Also, in high snowfall rate, melting does not occur fast enough to prevent gauge overflow
Freezing and frozen precipitation present a difficult problem for gauge measurement. This is particularly true for the popular automated tipping bucket gauge. To obtain a liquid equivalent measurement, the gauge must be heated to melt the frozen precipitation. This can and often does lead to sublimation or evaporation of precipitation without measuring it, resulting in underestimates. In addition, if the snowfall rate is very great, the melting will not occur fast enough to prevent gauge overflow, again leading to underestimation.
-
Precipitation rate impacts gauge accuracy
-
Primarily an issue with tipping bucket gauges
Precipitation rate can also impact the accuracy of the gauge measurement. [2] Although this varies with gauge design, the problem has been primarily with the tipping bucket style gauge as described in the rain gauge webcast referred to earlier.
-
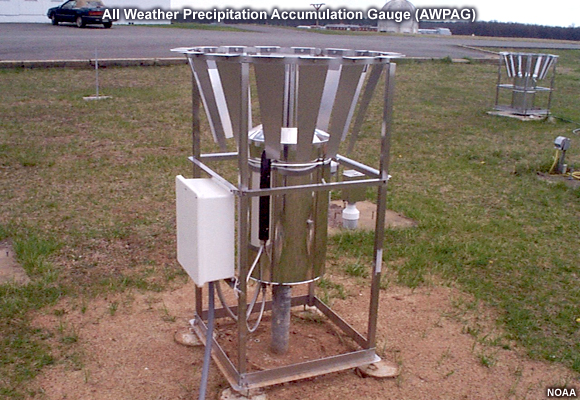
AWPAG weighs frozen precipitation to determine liquid equivalent
-
Smaller heated area, less error than for tipping bucket gauges
-
Initial results disappointing for snow
-
Perhaps due to wind effects
-
New double wind shield version being tested
-
The NWS is testing an automated “weighing” gauge known as the all weather precipitation gauge (AWPAG). There is still some heating of the rim to help direct snow into the gauge where a weight will determine the liquid equivalent. However, the heated area is not nearly as large as that in the tipping bucket gauges used by the NWS. Therefore, the errors with evaporation and sublimation should be reduced.
Initial testing showed disappointing results in snow, perhaps due mainly to wind effects.
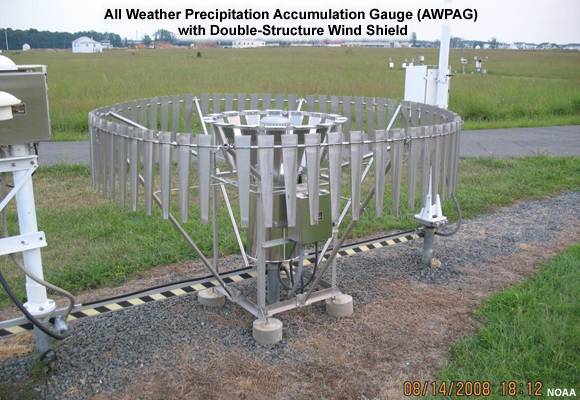
A new double wind shield version of the AWPAG gauge that is being deployed may help reduce the problems with measuring snow.
As mentioned earlier, “snow pillow” estimates at SNOTEL sites are often used instead of gauges where they are available.
Measurements from Manual Gauges
Problems with manual gauges may be identified and corrected more quickly, including:
-
Insect/bird activity
-
Leakage
-
Overflow of snow
-
Blockage from vegetation
-
Vandalism
Manual gauge reports suffer from the lack of high temporal resolution. This makes manual reports less suitable for software programs that need fast access to high resolution gauge reports.
However, manual gauges are visited routinely and therefore problems that affect gauge measurement may be identified more quickly. These problems can include insect or bird nests, leakage, overflow, blockage from rapidly growing vegetation, and vandalism.
Provided that gauge overflow does not occur during intense hail or snowfall, manual gauges may allow more accurate liquid equivalent measurements with frozen precipitation. Snow and hail are melted and measured manually.
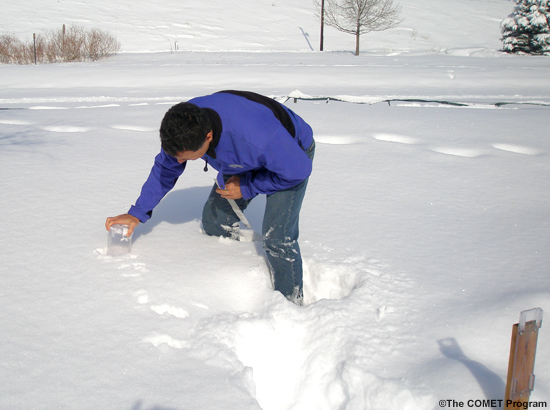
In addition, the observer may collect a “core” measurement of snow from the ground if she/he determines that this will provide a more representative sample than the snow that was collected by the gauge. Core measurements are intended to minimize the errors caused by the wind. A well trained observer may therefore provide improved liquid equivalent readings.
There are numerous manual gauge networks. Two well-known ones are the cooperative observing network and the Community Collaborative Rain, Hail, and Snow observing network (CoCoRaHS).
The cooperative observing network, which is sponsored by NOAA’s National Weather Service, has observers in every state. network still uses manual gauges.
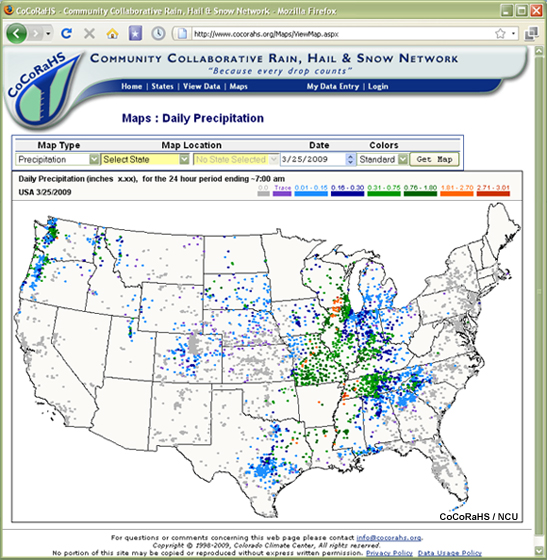
The CoCoRaHS network is nearly nationwide in the United States and may be fully nationwide shortly after the publication of this training.
Rain Gauge QPE Key Points
-
Gauge reports excellent for well-maintained, optimally located gauges in light winds
-
Rain gauges do not necessarily provide good spatial resolution
-
Significant underestimation error in strong winds
-
Gauge undercatch affected by variability in wind and hydrometeors
-
High wind: possibly greater inaccuracy in gauge data than in radar data
Rain gauges can provide excellent information if they are well-maintained, optimally located, and the wind is light.
Rain gauges are point estimates and will not necessarily provide good spatial resolution.
Wind causes significant errors in the gauge catch resulting in underestimation errors. These errors are greatest in strong wind, for exposed gauges, and for snowflakes and small liquid drops.
Wind-induced fall angles reduce the effective catch area of the gauge. Turbulence can induce downward motion that partially offsets the fall angle problem.
In situations where good radar coverage exists, it is possible that high wind situations may cause greater uncertainties in the accuracy of the gauges than that of the radar. A user of multiple precipitation sensors may want to consider the possibility that under such conditions it may not be wise to adjust the radar with the rain gauge data.
Review Questions
1. Gauges are not necessarily ground truth because they are subject to quantitative errors and they _____.
Choose the best answer.
The correct answer is a.
2. In high wind situations, the gauge measurement _____.
Choose all that apply.
The correct answers are b and d.
3. In windy conditions the most accurate gauge measurements will occur with well-maintained gauges and _____.
Choose all that apply.
The correct answers are a and c.
4. A general rule of thumb is to expect a 1% loss of rainfall measured by the gauge for every _____ increase in wind speed.
Choose the best answer.
The correct answer is c.
Precipitation Climatology/PRISM
Topics in this section include:
-
Rationale for PRISM
-
Use of PRISM
-
Other precipitation climatology tools
-
Limitations of using climatology for QPE
Precipitation climatology guidance can be used to help fill in the gaps where estimates of observed precipitation
are poor.
The most widely used precipitation climatology tool in the United States as of 2009 is the Parameter-elevation
Regressions on an Independent Slopes Model, or PRISM. Prior to its use in MPE, PRISM was used extensively
in several River Forecast Centers in the western United States.
Topics in this section include the rationale for PRISM, the use of PRISM data, NCDC precipitation climatology tools, and limitations of using precipitation climatology for QPE.
PRISM
Products and presentations are available for download from the PRISM group at Oregon State University: http://www.prism.oregonstate.edu/
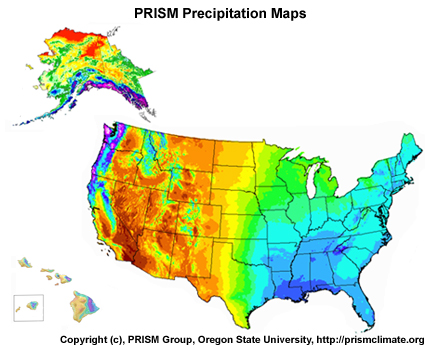
Developed at Oregon State University, PRISM climatology products include precipitation climatologies for several parts of the world. For the United States NWS the precipitation climatology guidance includes the contiguous United States...
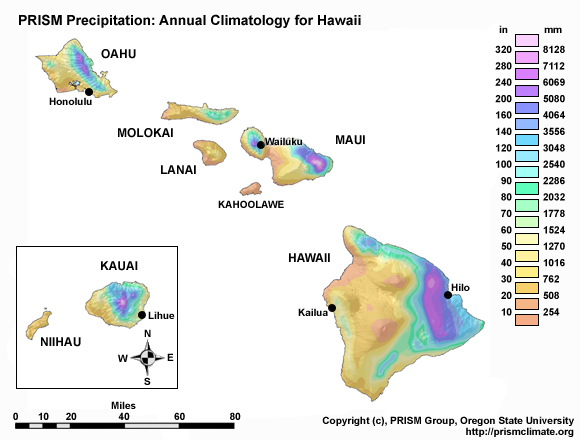
...the Hawaiian Islands, Puerto Rico, Guam, and...
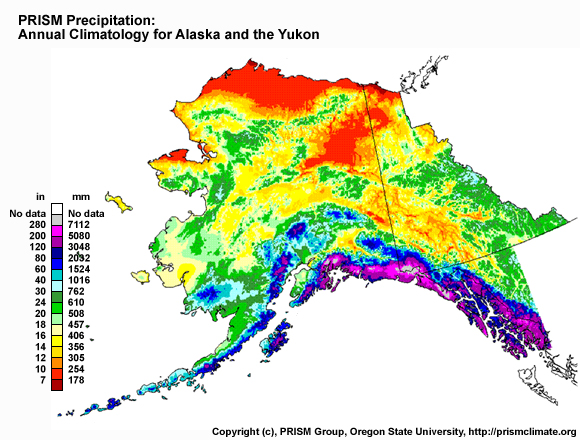
...Alaska, along with portions of neighboring Canadian provinces.
Products and detailed presentations about deriving those products can be downloaded from the PRISM group at Oregon State University.
PRISM precipitation climatologies use:
-
Historic record of measured precipitation
-
Geographic input, especially terrain
And in some cases:
-
Prevailing wind direction
-
Streamflow measurements
PRISM precipitation climatologies are based on the historic record of measured precipitation at point locations, geographic input, especially terrain information, and in some cases, the prevailing wind direction. Streamflow discharge measurements are used to correlate basin precipitation climatology with runoff climatology and thus provide a rough validation check on the precipitation amount.
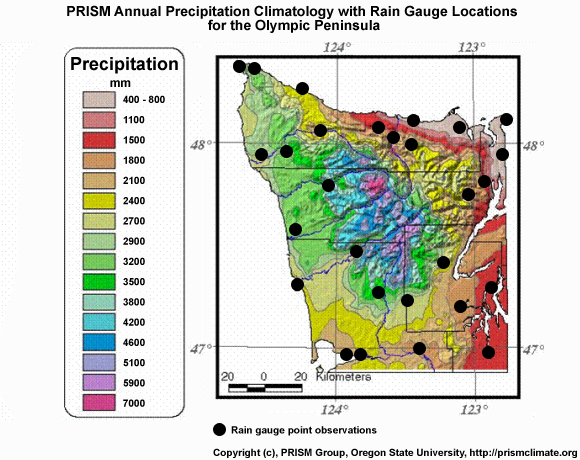
Point observations are rarely sufficient to represent spatial patterns of precipitation. This is especially true in regions with sharp changes in elevation and/or nearby large bodies of water. PRISM uses the known relationships of precipitation with geographic features. An automated statistical approach is used for efficiency, but this is guided by human expertise.
Basic Use of PRISM
PRISM Precipitation climatology used for both
-
QPE (observed)
-
QPF (forecast)
PRISM precipitation climatology may be used for both observed precipitation (QPE) and forecast precipitation (QPF).
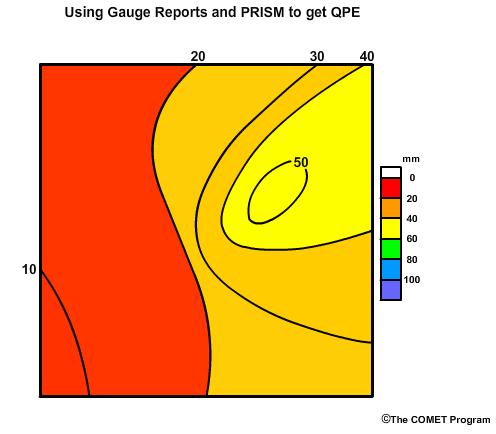
Deriving QPE from PRISM precipitation climatology starts with point values...
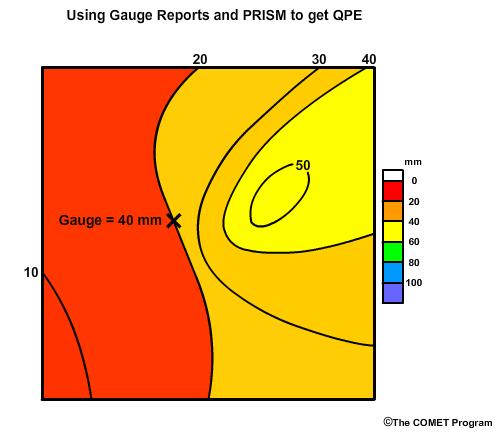
... such as reading from a rain gauge. From there we derive the ratio of the point value to the PRISM value.
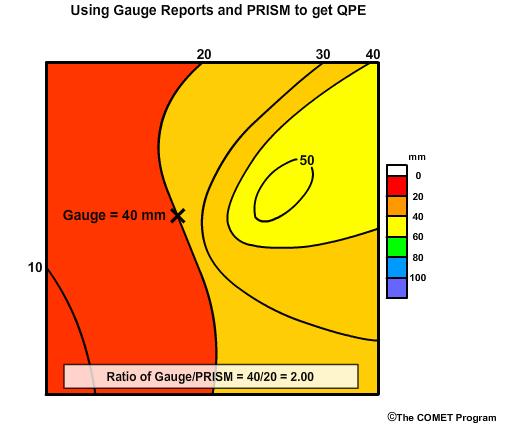
In this example we assume the gauge reading is 40 mm (1.57 in) and the PRISM value at that point is 20 mm (0.79 in). The ratio of 40 over 20 is 2.0. Now, we apply that ratio to other PRISM values.
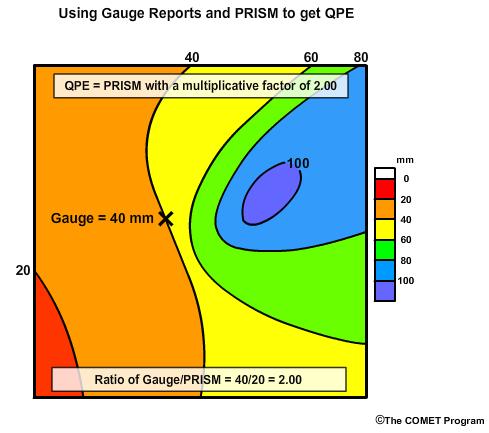
This adjusts the areal precipitation estimate by the ratio of 2.0 but it preserves the gradients and the relative magnitudes that we see in the PRISM data.
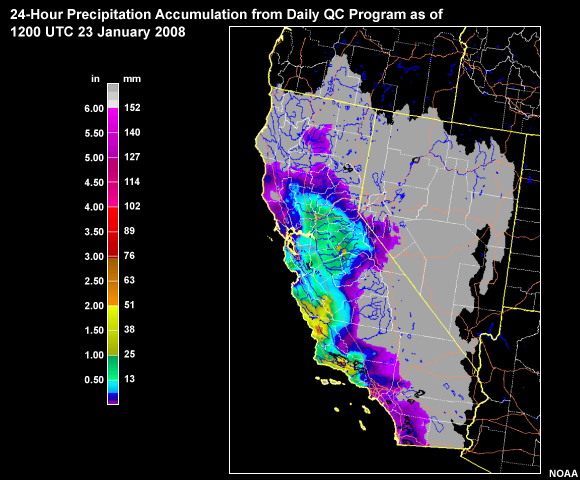
Of course this process is done for numerous gauge locations using distance-weighting schemes. This is the basic functionality of an MPE component called Daily QC. Daily QC was developed as part of the Mountain Mapper system in the western United States and it produces quality-controlled, PRISM-adjusted, gauge analyses.
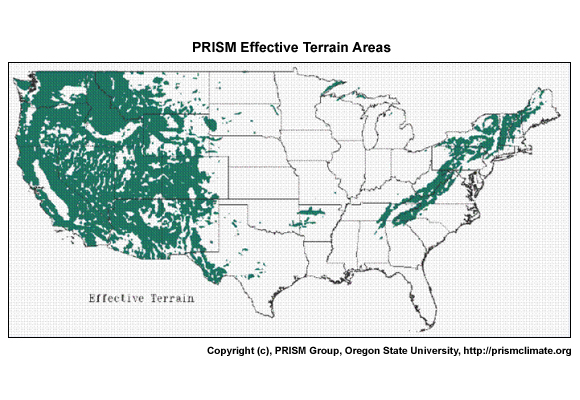
This approach using gauge and terrain data is considered the 3-dimensional (3-D) approach. This can be very useful in terrain-affected areas. The areas that are within 100 km of the green shading on this map are where PRISM uses the 3-D approach for QPE. This would also include all of the Hawaiian Islands and most of Alaska.
In the white areas on this map, PRISM uses a 2-D process. This is basically a distance-weighted gauge analysis.
Other Precipitation Climatology Tools
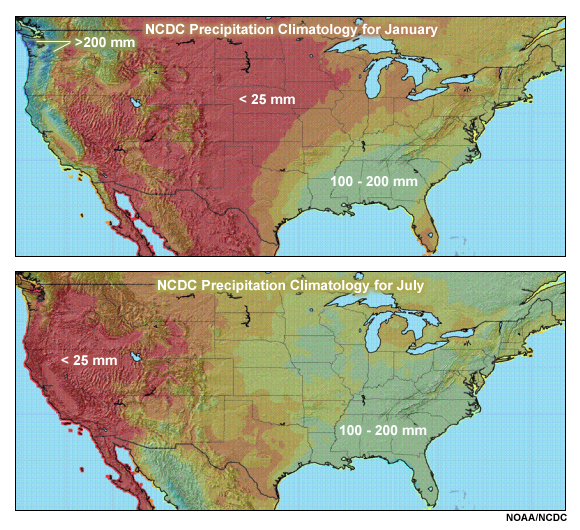
The U.S. National Climatic Data Center (NCDC) is developing another potential tool for spatial climate data. Precipitation products will be part of this NCDC climate tool. Here we see the preliminary look at products for January and July precipitation climatology in the contiguous United States. At this time it looks as if products may become available for use in 2010.
Limitations of Precipitation Climatology
-
Climatology data average out individual events
-
Individual events can show large departures from climatology
-
Values tend to be closer to climatology with:
-
Orographically-driven precipitation
-
Widespread, stratiform precipitation
-
As with any climatological data, there are limitations. Climatology averages the individual events in a data set. Individual precipitation events may show large departures from climatology, especially in the locations of extrema and sharp gradients. However, even with these limitations, there are regions that will likely benefit somewhat from climatological tools.
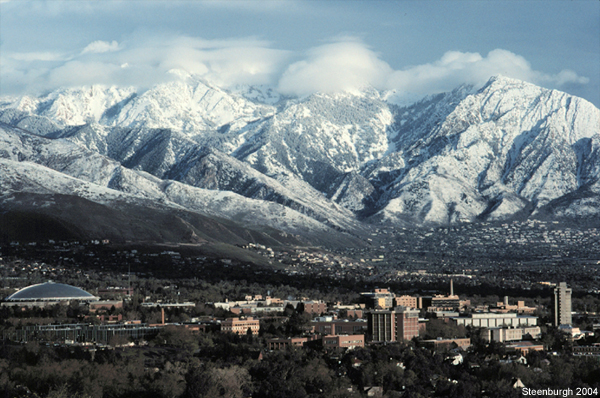
Individual events will often be closer to climatology in regions with large orographic influences.
In addition, regions that tend to receive widespread, stratiform precipitation will be closer to climatology than areas dominated by convection.
So the western coasts of North America may be the areas that can benefit most from climatological adjustments to QPE. Keep in mind that departures from climatological norms will likely have greater impacts as one looks at smaller basins.
Review Questions
1. Climatology guidance like PRISM is useful in areas with good radar coverage, but very few gauges.
Choose the best answer.
The correct answer is b.
2. Climatological guidance is likely to be most useful in regions with _____ and _____.
Choose the best answer.
The correct answer is b.
3. Climatological adjustments to QPE may misrepresent the distribution of precipitation that is _____.
Choose the best answer.
The correct answer is c.
Summary
Observed liquid equivalent of precipitation can be measured directly from rain gauges, or indirectly from remote sensing tools. Remote sensing tools include radar and satellite. Measured precipitation fields are sometimes altered with climatological tools.
Remote sensing tools have the advantage of providing indirect measurements over a broad spatial area. Radar-derived products in particular can provide excellent spatial and temporal resolution. But remotely sensed precipitation estimates are subject to errors related to the properties of the sensor and characteristics of the precipitation.
Direct measurement from gauges is often referred to as ground truth. However, errors are associated with the type of gauge, characteristics of the precipitation, and the wind. In addition, the gauges often do not represent spatial detail.
Climatological adjustments offer a method for filling in data void regions with useful data. But these adjustments can be misleading for precipitation systems that depart from climatological norms.
Part II of this 2-module series on precipitation estimates explores how to combine the measurements from multiple sensors into an optimal analysis of observed precipitation.
Congratulations! You have completed this module. Please take a moment to take the quiz and to provide us with your feedback by completing a brief survey.