Detection
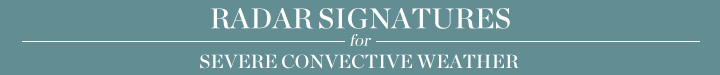
Strong low–level convergence below a storm's updraft can be an indicator of an intensifying or strong updraft. Identifying convergence is best done using radial velocity data from a Doppler radar. Convergence requires winds to approach one another along a radial and should be collocated with the updraft.
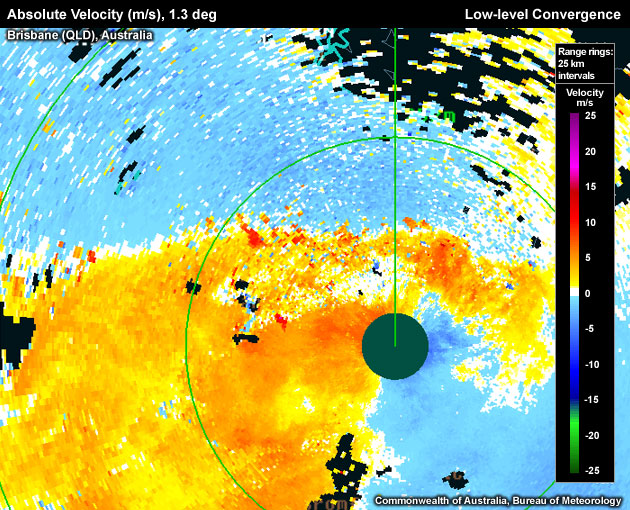
Low level convergence associated with an updraft (updraft location is marked by a red hollow circle). Maximum inbound velocity is aliased (red pixels).
To determine if the signature you are seeing is an updrfat tied to low-level convergence, use the following criteria:
Reflectivity: PPI/Plan View
- Step up in elevation scans until you run out of >50 dBZ echoes
- Step down one elevation scan.
- Centre cursor on the upshear side of the >50 dBZ core (this is to account for storm movement during the time interval between the lowest and the storm top tilt, especially in strong winds aloft).
- Set a reference point.
- Step down to the lowest elevation scan.
- Switch to velocity data.
Velocity: PPI/Plan View
Is the reference point found in the previous step collocated with velocity convergence (i.e. the zero isodop line with inbound radial velocities downrange and outbound ones uprange)? If yes, a Low–level Convergence signature is present.
Potential Difficulties in Detection
- As only two–dimensional velocity data is displayed on any PPI image, an apparent convergence signature may only be indicative of confluence associated with weak upward motion.
- Aliasing Folded or strong velocity values, especially in strong background flow or on C–band radars with lower Nyquist velocities, may be difficult to recognise
- Viewing angle If convergence sets up such that the converging winds point across, or normal to, the radial, the convergence signature won't show up in Doppler velocity data.
- Strong unidirectional background flow – If using ground–relative velocity data, a convergence signature may appear only as a decrease in velocity rather than a change in sign
- Radar sampling – "Noisy" velocity data may be present, usually due to dual PRT algorithm unfolding errors on Australian radars.
Examples of Low-level Converegence
Low–level convergence associated with an updraft (updraft marked by a red hollow circle). The maximum inbound velocity is aliased (red pixels).
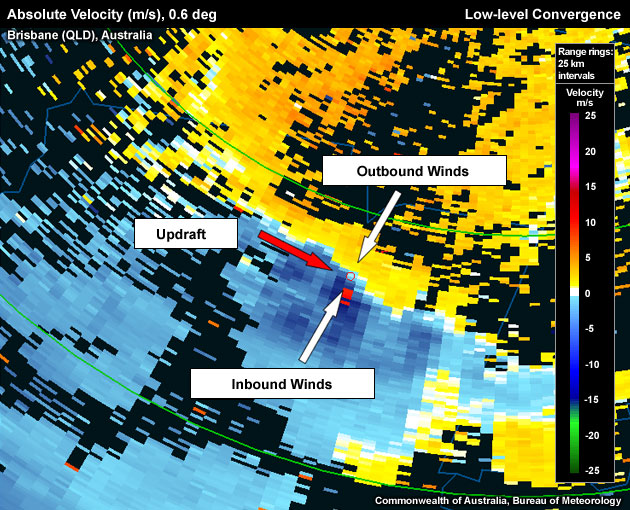
Low–level convergence along a surging gust front from a storm to the south of the boundary. Gust fronts such as this one often initiate new deep convection.
Low–level convergence along a gust front from a storm to the south of the boundary.
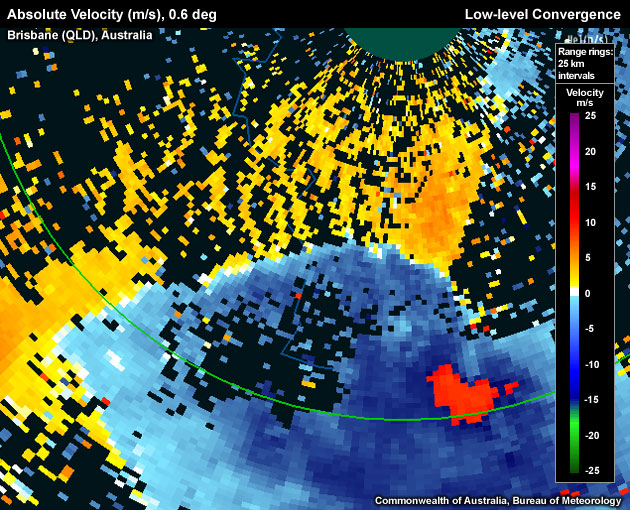
Low–level Convergence signature marking a northward–moving cold front north of the radar location. Storms that manage to keep pace with the northward movement of the convergent boundary would increase their chances of development.
Low-level Convergence Look–a–Likes
- Signature not collocated with updraft - You might be detecting convergence, but not convergence feeding into an updraft of a thunderstorm.
- Aliasing Not recognising aliased data can give the impression of convergence, but merely indicates unidirectional flow that is increasing in strength past the radar's Nyquist velocity.