
MCS Structure on Radar
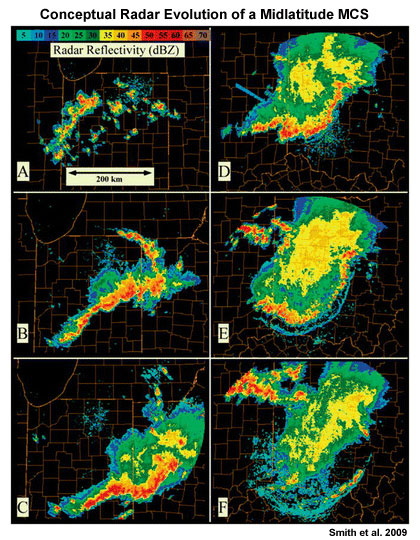
Fig. 1: Typical radar evolution of a linear, trailing stratiform MCS in the United States. Shortly after initiation, a cluster of isolated cells (A) starts to form a large, combined cold pool which leads to the formation of a more continuous line of deep convection (B,C). Over time, a trailing stratiform precipitation region forms (C,D). A system-scale gust front begins to outrun the leading line of active convection (D,E) which ultimately leads to the demise of that line. A new line of convection initiates along the runaway gust front in (F).
Fig. 1 above illustrates the overall evolution of a typical linear, trailing stratiform MCS as well as some of the attendant radar signatures that can be used to identify the potential and/or occurrence of damaging surface winds. These, and other signatures and severe wind phenomena that are commonly associated with linear MCSs, are summarized below.
Bow Echo (Fig. 1, panels C-F)
Fujita (1978) observed symmetric bow-shaped convective line segments 20-120km long that tended to produce extended swaths of damaging surface winds and first referred to them as "bow echoes." In most cases either a very strong rear-inflow jet or a strong downdraft deforms the leading active line of convection into a bow-shaped arrangement. While bow echoes, a special type of severe linear MCS, can occur over a wide range of shear and instability regimes, they most commonly occur in high CAPE and high shear environments and possess deep, slab-like lifting along the bowed-out gust front of a strong cold pool. Bow echoes can evolve as an accelerating segment of a squall line, or from a single strong storm (usually a high precipitation supercell; Finley et al. 2001). The transition into a bow is usually on the order of an hour or two.
Rear Inflow Notch
A rear-inflow notch (RIN), which marks an evaporatively cooled strong rear-inflow jet (Przybylinski and Schmocker 1993; see Fig. 2) is often evident just before and during the leading line's initial transformation into a bow echo.
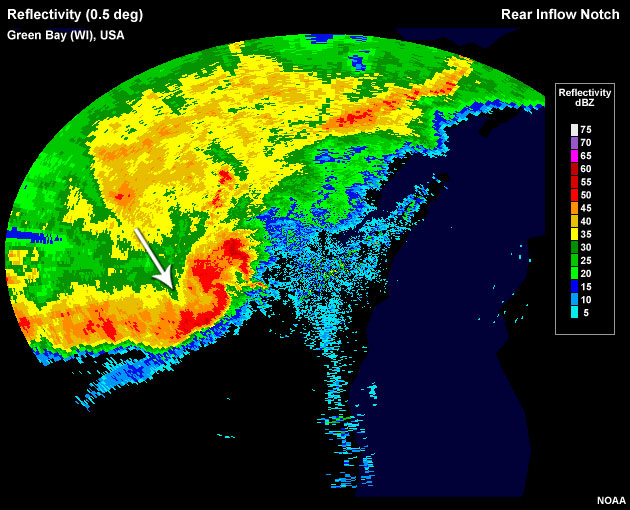
Fig. 2: Rear inflow notch evident as an area of weakened reflectivities behind a newly-formed bow echo in the north-central United States.
Bookend Vortices
The mature bow echo often contains one or two bookend vortices. Bookend vortices generally mark a region of enhanced downdraft and an increased probability of stronger winds at the surface. The distance between both bookend vortices is one measure of the likely strength of the RIJ, with smaller distances associated with stronger RIJs (Weisman 1992). Line-end vortices tend to drift rearward (relative to the MCS) in weaker shear environments, but are more likely to stay with the leading edge of convection in stronger shear environments. For a sufficiently persistent MCS, the Coriolis force eventually leads to a strengthening of the cyclonic (or poleward) bookend vortex and a weakening of the anticyclonic (or equatorward) vortex. In that case the MCS eventually assumes a comma-shaped appearance (comma echo).
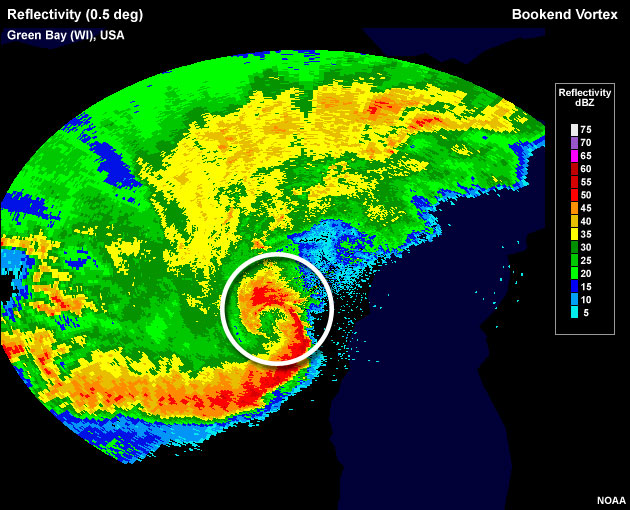
Fig. 3: Mature bow echo over Green Bay (Wisconsin, USA) showing a well-developed bookend vortex at the poleward end of the MCS.
While the strongest winds commonly occur at the bow's apex, bow echoes can also contain weak tornadoes, or mesovortices, along the leading edge of the bow usually near and poleward of the bow's apex (Atkins et al. 2005; Atkins and Laurent 2009a,b).
A bow echo's motion vector is controlled by the propagation of the strong cold pool with bow echoes tending to move much faster than other surrounding multicells.
Derechoes
A long-lasting (up to a day) severe wind event that extends over at least 250 nm (463 km) and contains multiple 65+ kts (33.5 m/s) wind gusts has been observed and first defined as a derecho in Johns and Hirt (1987). Such events are usually produced by a sequence of one or more severe bow echoes. Often the damaging winds occur within several distinct episodes.
While derechoes can occur over a wide range of shear and instability regimes, they most commonly occur in an environment with strong deep layer shear combined with high CAPE, steep midlevel lapse rates and a strong system cold pool. Of importance for discriminating derecho from non-derecho environments are the strength of the 0-6km mean winds and the 0-2 km system-relative flow, the latter being mostly due to the fast system speed itself (Evans and Doswell 2001).
Derechoes occur either as progressive derechoes, where short bow echo segments move along a quasi-stationary front (Fig. 4, Progressive Derecho), or as serial derechoes where a squall line moves approximately at right angles to the steering flow and contains individual severe bow echoes that rapidly move along the line and with the steering flow (Fig. 4, Serial Derecho).
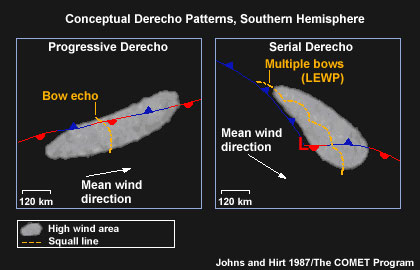
Fig. 4: Conceptualisation of the two derecho types. The orange line segment marks a typical instantaneous snap shot of the active convection.
Radar animation of a derecho that caused widespread damage as it moved over Oklahoma and Texas, United States. The animation shows 10 hours of the system's lifetime.
Other Radar Indicators of Damaging Winds in MCSs
Two MCS regions that pose an increased threat of damaging winds are squall line segments where the gust front stays close to the leading edge of the low-level reflectivity core, and segments with strong low-level reflectivity gradients.
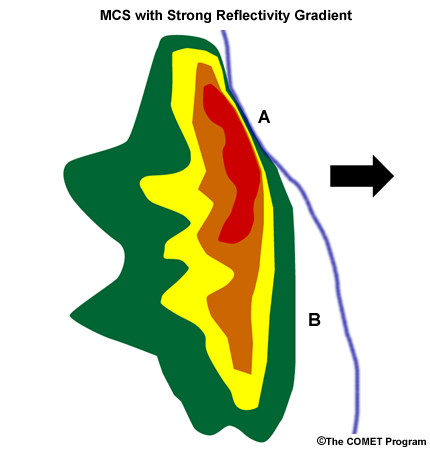
Fig. 5: Conceptual model of an MCS moving left to right. Shown qualitatively as a low-level horizontal slice through the radar reflectivity of the system. The blue line ahead of the low-level reflectivity core marks the system gust front. Point A shows a gust front that stays close to the leading deep updrafts of the system and a tight low-level reflectivity gradient. Both indicators suggest an enhanced likelihood for damaging winds near point A. Point B shows a gust front that has outrun the core, and a very broad reflectivity gradient. The damaging wind risk here is significantly lower that at point A.
In any event, it is useful to search for additional radar-based evidence of individual cell severity, such as the presence of a Weak Echo Region (WER) in the vicinity of point A in Fig. 5 above.
As one approach for forecasting the onset of damaging surface winds, a system-relative velocity image might show a Mid-Altitude Radial Convergence or MARC signature near the leading edge of the midlevel intense reflectivity core of the system as a precursor to the descent of an elevated RIJ (Przybylinski et al. 1995) and therefore as a precursor to the onset of damaging winds on the surface.
Use the radio buttons or click the image to switch between reflectivity and velocity imagery:
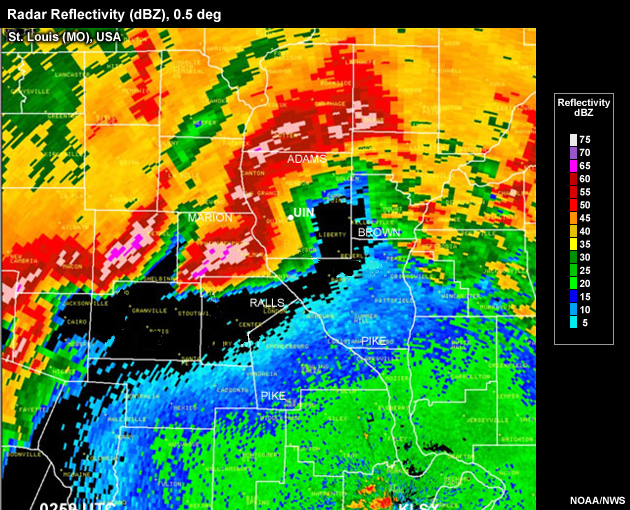
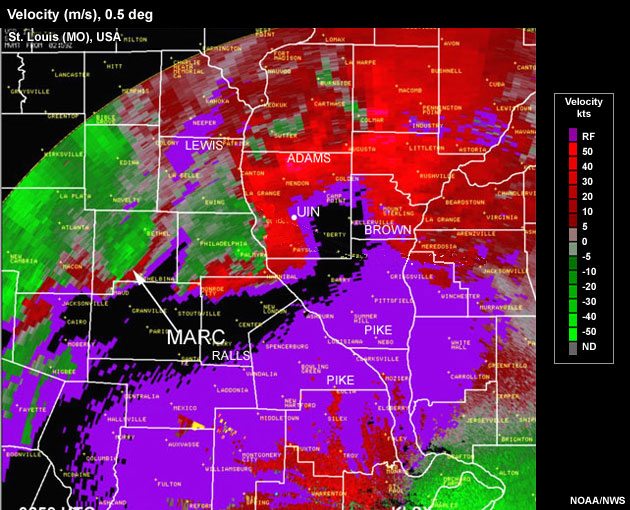
Radar reflectivity and storm-relative velocity image of a bow echo that exhibits a Mid-Altitude Radial Convergence (MARC) signature. Elevation of beam at location of signature is approximately 11,500 ft AGL.