«- back to print version table of contents
Forward Flank Notch
Detection
A Forward Flank Notch (FFN) signature, also known as a "flying eagle" or "flying V" signature, is named after the shape of the reflectivity echo along the leading edge of certain thunderstorms. This signature is typically, but not exclusively, found in the midlevels.
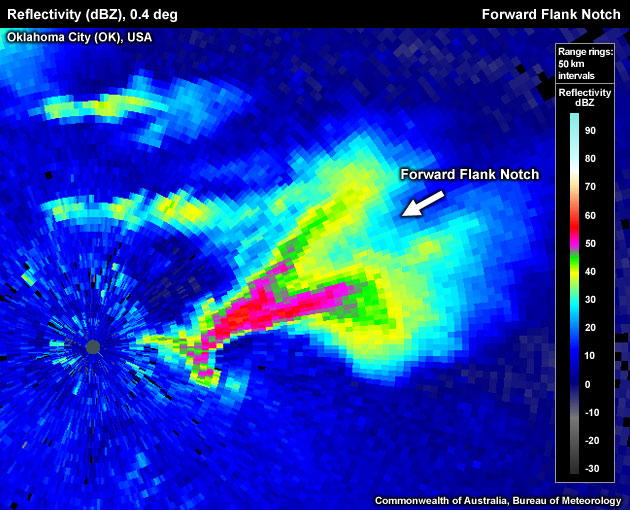
Pronounced FFN at low levels associated with a tornadic supercell just east of the Twin Lakes radar east of Oklahoma City on 3 May 1999.
The creation process for the FFN include a downshear dynamically created low in a situation where strong storm–relative flow interacts with a strong and persistent updraft, Bernoulli acceleration on the flanks of a storm with a strong updraft, or a wake eddy effect. The FFN should be distinguished from the "inflow notch" created by low–level, hydrometeor–sparse inflow into an updraft (see look–a–likes below). To determine if the signature you are seeing is a FFN use the following technique:
Reflectivity: PPI/Plan View
- Step up in elevation until you are viewing the middle elevations of the storm.
- Look for a V shape on the leading edge of the storms core. This is more often evident in the lighter reflectivities (>45dBZ), but is sometimes present in stronger reflectivities .
- Is there a V shape evident on the leading edge? If yes, a FFN is present.
Potential Difficulties in Detection
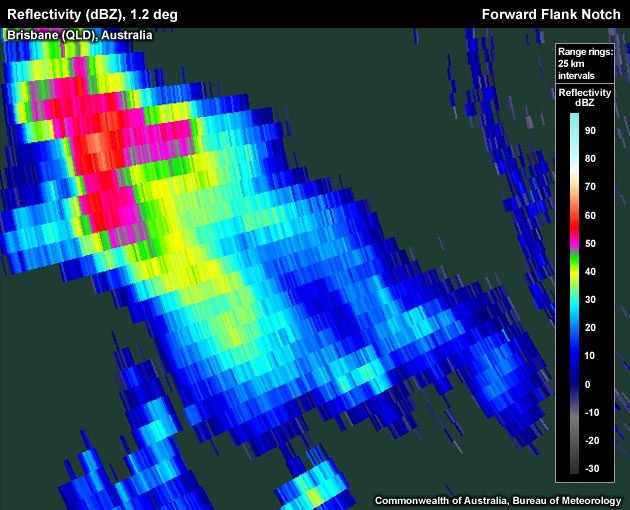
Deceptive colour transitions – FFNs can be hard to recognise, as the signature might be embedded in a part of the reflectivity colour palette where the colour changes very slowly with increasing reflectivity values.
FFN signature in the 25–40 dBZ range is only apparent in the light blue and yellow colours.
Examples of Forward Flank Notches
Pronounced FFN at low levels on the northeast flank of a tornadic supercell just east of the Twin Lakes radar east of Oklahoma City on 3 May 1999.
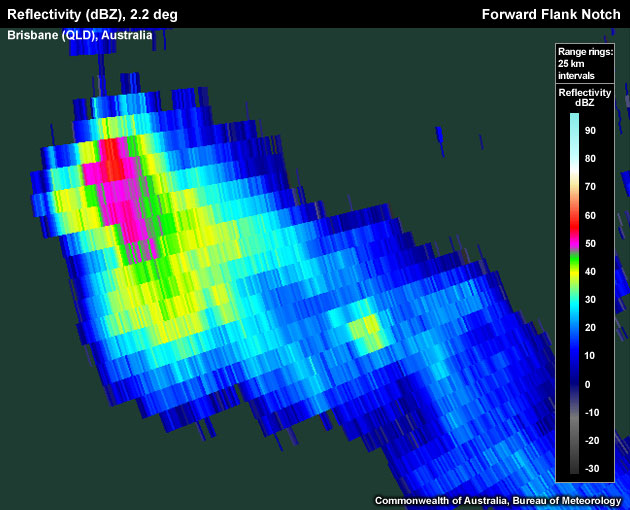
FFN signature on the storms southeast flank.
Note that the FFN signature on the southeast side of the storm is most pronounced in the lower reflectivity values.
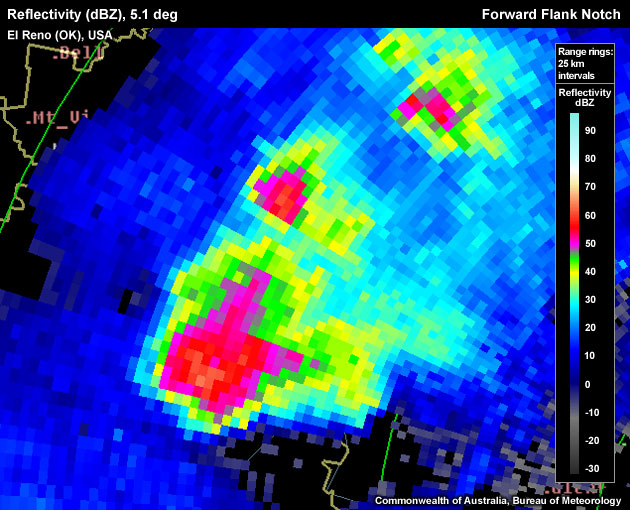
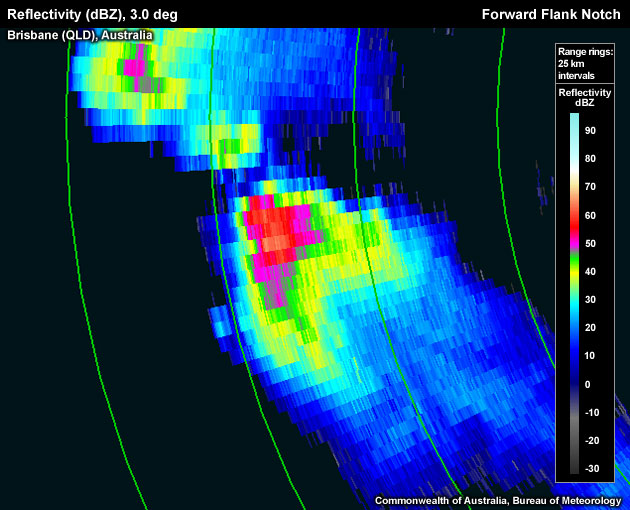
A pronounced FFN as part of a right–moving supercell near El Reno (Oklahoma, USA).

Not a "classic" FFN, located on the northeastern side of the storm.
Forward Flank Notch Look–a–likes
The most common FFN look-a-likes are:
- Inflow notch – this is the most common error made in diagnosing a FFN signature. The inflow notch is located in the low–levels of the storm on the inflow/updraft side.
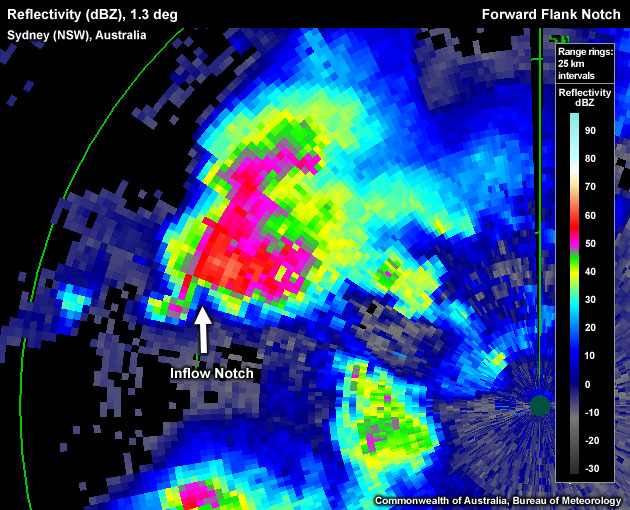
Inflow notch located in the low levels in the sparse radar target area of the updraft/inflow.
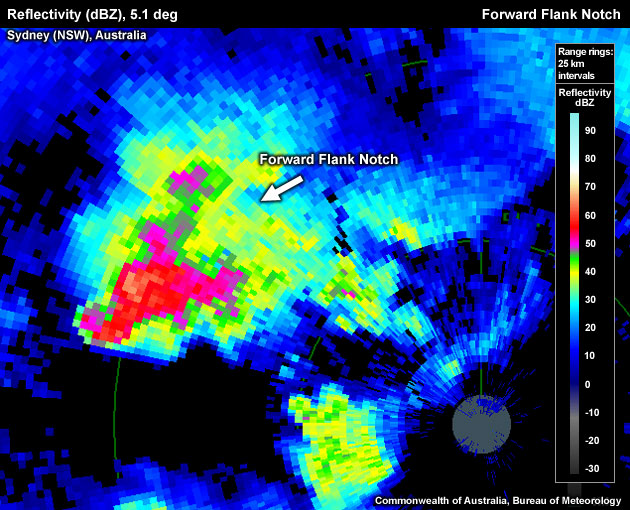
This is the correct identification of the forward flank notch for the storm analysed in the previous image. It is located in the mid–levels on the leading flank of the storm.
- Cores from multiple updrafts - Multicell storms can create a horizontal reflectivity distribution that may resemble the shape of a FFN.
- Three–body scatter spikes (TBSS) – this signature can create a reflectivity distribution that may appear to possess forward flank notches through false echoes.
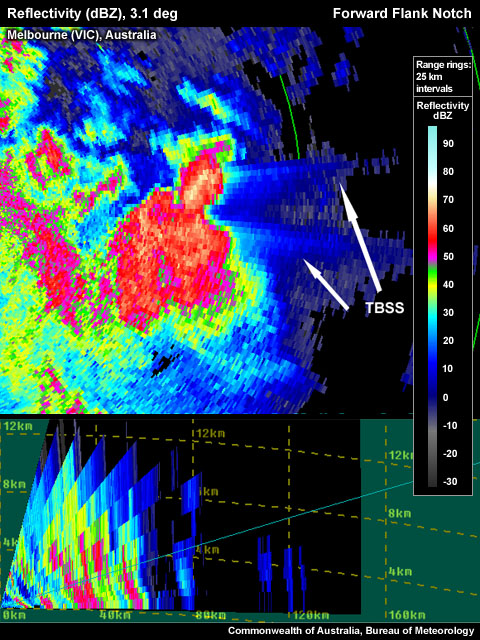
Three-body Scatter Spikes signatures from hail cores have produced a "false" forward flank notch.
- Wrong storm position - False FFN not downstream of the updraft.
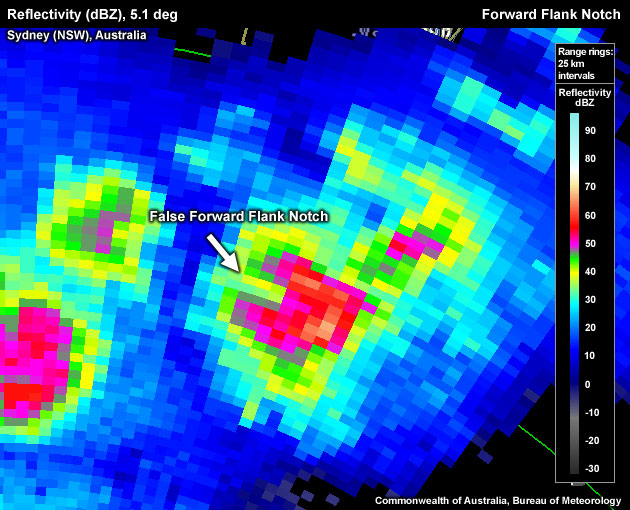
"False" Forward Flank Notch, recognisable based on the location in relation to the thunderstorm.
Conceptual Model
A Forward Flank Notch (FFN) signature is used as one of many signatures providing additional evidence for a severe thunderstorm (see Lemon 1976). The presence of a FFN signature indicates that a thunderstorm possesses a strong and persistent updraft. In fact, the FFN signature is usually associated with supercells. This signature is most commonly found at midlevels, as storm updrafts in an environment of steep midlevel lapse rates and storm–relative flows can both be strong at this elevation, and plenty of hydrometeors exist there to delineate the flow field. The physical mechanisms that create a FFN signature are still under investigation. Proposed candidates include a dynamically created downshear low in a situation where strong storm–relative flow interacts with a strong and persistent updraft, Bernoulli acceleration on the flanks of a storm with a strong updraft, or a wake eddy effect. Controversy exists surrounding the more intuitive explanation that a strong updraft simply "blocks" the ambient flow.
Determining Thunderstorm Classification
Forward Flank Notches are predominantly associated with supercells. To help determine the classification of a thunderstorm you are observing, use the following flow chart to help diagnose which thunderstorm conceptual model you should consider more closely.
See Supercell for more information.
Diagnosis
Once you have confidently identified a Forward Flank Notch signature, this section will help you estimate the storm severity associated with it. Generally, the spatial and temporal scales of a signature are loosely related to the updraft strength. In other words, the larger and/or more long–lived the signature, the stronger the updraft that produced it. In velocity–based signatures, updraft severity can usually also be gauged by the magnitude of the measured radial velocities. Examining a storms overall temporal evolution will suggest whether the storm is becoming more or less severe. Radar signatures and associated storm developments can also be time–shifted relative to each other, as is the case in supercell tornadoes that occur during the collapse of the parent storm.
When comparing signatures to diagnose relative severity, keep in mind that it is assumed that signatures are sampled at equal ranges from the radar. Otherwise, a storm sampled at greater range (with a wider beam) can appear to be weak and/or weakening, while a storm sampled at a closer range (with a narrower beam) can appear to be strong and/or strengthening.
Degree of Severity
- Longevity of the Forward Flank Notch – persistence of the Forward Flank Notch indicates that the attendant updraft is continually strong enough to maintain the signature. The FFN is therefore a proxy for the steadiness of the updraft strength.
Most Likely Convective Hazards
If a thunderstorm has been determined to be severe and possesses a Forward Flank Notch signature of significance, the following severe weather should be considered to be included in the severe thunderstorm warning:
- Damaging winds – a Forward Flank Notch is a representation of a strong updraft, with potential to produce a strong downdraft.
- Large hail – a strong updraft has the potential to produce large hail, providing the updraft extends past the freezing layer, to –10 to –30 °C (hail growth) layer. Some consideration of the temperature of the environment between the thunderstorm base and the ground is useful to identify the potential for hail melting on its descent to the ground.
If the FFN signature is indicative of a supercell, also consider flash flood potential for slower–moving or very large storms, and tornado potential in environments of high boundary layer relative humidity in strong 0–1 km shear.
See Conceptual Models for more details on why particular severe weather should be included.
References/Addendum
Lemon, L. R., 1976b: Wake vortex structure and aerodynamic origin in severe thunderstorms. J. Atmos. Sci., 33, 678–685.
Lemon, L. R., 1974: Interaction of two convective scales within a severe thunderstorm: A case study and thunderstorm wake vortex structure and aerodynamic origin. NOAA Tech. Memo. ERLTM–NSSL–71, National Severe Storms Laboratory, Norman, Oklahoma, 43 pp
Lemon, L. R., 1970: Formation and emergence of an anticyclonic eddy within a severe thunderstorm as revealed by radar and surface data. Preprints, 14th Conf. on Radar Meteor., Boston, Amer. Meteor. Soc., 323–32