
Definition of Supercells
Supercell thunderstorms are usually long-lived, intense, relatively large and often anomalously moving convective storms that produce a disproportionate fraction of severe convective weather. Supercells exhibit deep rotation within and near the storm’s updraft known as a mesocylone. For rotation associated with a convective storm to be classified as a mesocyclone, the vortex generally needs:
- to be of storm scale (~2-10 km in diameter),
- have reasonable vertical depth (~3 km),
- have a sufficient duration (~two successive radar volume scans),
- and meet a minimum strength criterion (rotational velocity of ~15 ms-1 or vertical vorticity of ~10-2 s-1).
Conceptual Supercell Formation and Evolution
The initial evolution of a persistent updraft embedded in deep layer shear shows some variations which depend on the type of vertical shear profile. In unidirectional vertical shear, horizontal vorticity inherent in the vertical shear profile is tilted into the vertical by the updraft to yield a vertical vorticity couplet of opposite signs or counter-rotating vortices.
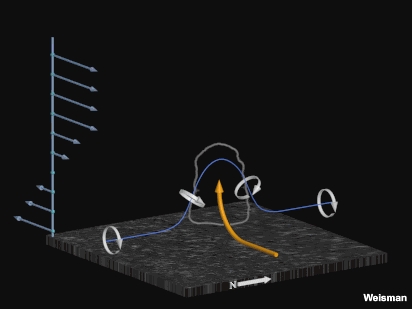
Fig. 1: Tilting of horizontal vortex lines by an updraft in unidirectional shear.
Initially, these vortices form on the left and right flanks of the updraft and are associated with dynamic lows. The rotation-induced perturbation pressure lows associated with the above circulations are also referred to as nonlinear perturbation pressure lows where the perturbation pressure is proportional and opposite in sign to the square of the vertical vorticity (see Bluestein 1993, p. 468).
![]()
Within these storm-scale lows, the pressure is lowest at midlevels where the updraft (and hence the tilting of horizontal vorticity) is strongest.
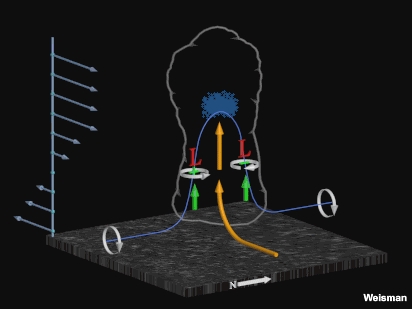
Fig. 2: Conceptual model of dynamically driven storm-scale lows associated with the midlevel circulations near the updraft flanks.
As a result, an enhanced upward-directed perturbation pressure gradient force below both vortices promotes the development of new updrafts near the centre of each midlevel vortex (Fig. 2). This development widens the original updraft through growth of strong new updrafts on the left and right flank. A downward pointing vertical pressure gradient force develops between the two flanking updrafts which, aided by the cooling effects associated with and descent of a precipitation core, can lead to storm splitting (Fig. 3).
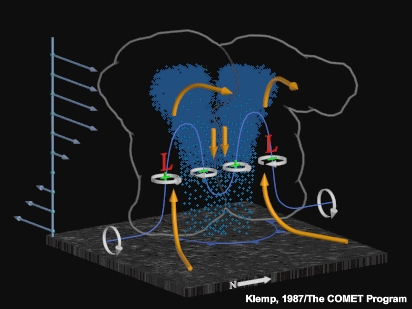
Fig. 3: Schematic of preferred updraft growth near the flanking lows, leading to the onset of storm splitting.
In a unidirectional shear profile, equally intense left- and right-moving storms develop, while left-movers are preferred in counter-clockwise hodographs and right-movers in clockwise hodographs (Fig. 4).
Fig. 4: Schematic that shows preferred supercell propagation behaviour as a function of the hodograph shape.
The reason why curved hodographs imply a preference for left- or right-movers lies with a second mechanism of how deep-layer shear creates perturbation pressure patterns in and around an updraft. Bluestein (1993, pp. 463-465) derives a second relationship stating that storm-scale perturbation pressure is related to the projection of the environmental vertical shear vector onto the vertical velocity gradient associated with the updraft:

The environmental shear-induced perturbation pressure is commonly referred to as the linear perturbation pressure. Analogous to the nonlinear perturbation pressure setting up within storm-scale rotation centres, the linear perturbation pressure is maximised near the periphery of the updraft according to an "upshear highs downshear lows" rule (Fig. 5):
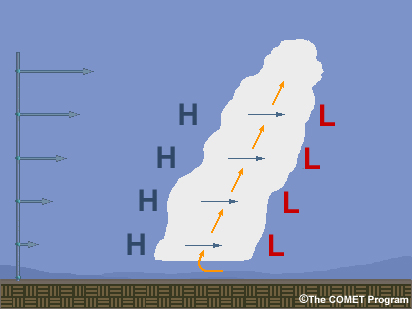
Fig. 5: Arrangement pattern of the linear perturbation pressure associated with a straight-line vertical shear profile. Perturbation highs set up on the upshear side, perturbation lows on the downshear side.
The arrangement of the linear pressure perturbations in curved hodographs changes with height due to the shear vector orientation changing with height. Furthermore, the strongest vertical velocities within the updraft, and therefore the strongest horizontal gradients thereof, occur in the midlevels. It is at that level that the strongest linear perturbation lows and highs setup. In counter-clockwise hodographs, the dominating midlevel perturbation low is found on the northern flank of the updraft, encouraging northward propagation of the storm and (given a westerly steering flow) overall leftward motion as indicated in Fig. 6.
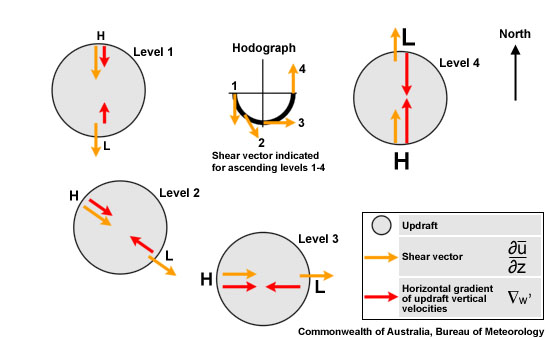
Fig. 6: Changing arrangement of upshear high and downshear low linear pressure perturbations around an updraft embedded in a counter-clockwise hodograph. The yellow arrows show the environmental vertical shear vector at a particular level, the red arrows show the corresponding horizontal gradients of the updraft vertical velocities. The strongest linear perturbation low sets up at midlevels on the northern flank, encouraging new updraft formation there and thus overall leftward motion (that is northeastward motion in westerly steering).
Once the storm moves off the hodograph, either due to the linear or the nonlinear shear effect or the hodograph curvature itself, the tilting of environmental horizontal vorticity changes character compared to the process shown in Fig. 7a. Movement off the hodograph implies that environmental horizontal vorticity is more aligned with the storm-relative inflow vector (Fig. 7b) which, once tilted, leads to vertical vorticity of one sign dominating rather than a vortex couplet as shown in Fig. 5. Vorticity vectors that point across the storm-relative inflow vector are referred to as crosswise vorticity; those aligned with it along it are referred to as streamwise vorticity. Left-moving and right-moving storms have much more potential for intensification as they ingest a higher proportion of streamwise vorticity compared to those cells that dont move deviantly.
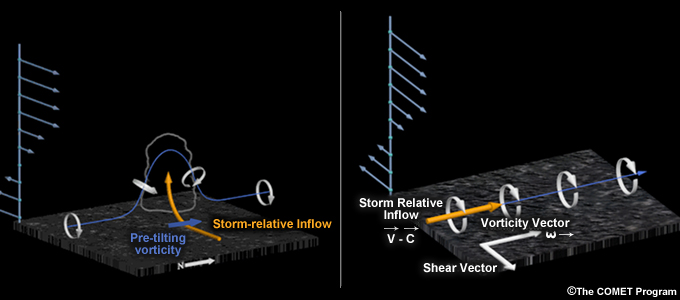
Fig. 7: Tilting of crosswise vorticity (a) and streamwise vorticity (b).
Integrated through the whole depth of a storms inflow layer (nominally set at 3 km), the total amount of streamwise vorticity ingested through the inflow is referred to as the storm-relative helicity (Davies-Jones 1984,1990).