«- back to print version table of contents
Anomalous Storm Propagation
Detection
When the direction of storm propagation is different from the steering wind, it is a signature of the potential for severe convection. Most thunderstorms typically move with the steering wind, calculated as a pressure–weighted mean of the environmental horizontal winds over the depth of the storm. Often, mid–level winds are used as an approximation for the steering wind because the storms centre of mass is located there. A storms motion could be anomalous in direction and/or speed. To determine if you are seeing a Anomalous Storm Propagation signature, follow the techniques illustrated in the sections below.
Loop of a supercell storm splitting into a dominant left–mover and smaller right–mover. Both of these storms move differently to the steering flow after splitting. It is important to make sure you are tracking the same part of the storm when assessing anomalous storm motion.
Reflectivity: PPI/Plan View
To determine the movement of a storm you need to track the same part of the storm. Usually the easiest part to track is the storm top, as described below.
- Loop the latest few scans (say 20–30 minutes worth, weighting towards the most recent scans, due to the possibility that the storm has only just started to move anomalously).
- Is the storm moving differently to other thunderstorms or showers in the area? If so, your storm is moving anomalously to steering flow.
- If the storm is the only observable feature on radar, a comparison between the storm motion and a representative observed steering wind should be undertaken. The representative steering wind could be obtained from a number of different sources such as a recent sounding, a wind profiler, AMDAR or even the velocity data if your radar is a Doppler radar. If the storm is moving differently to the steering wind, your storm is propagating anomalously.
To find the storm motion vector at a given time, perform the following:
- Step back three or four volume scans.
- Step up in elevation until you run out of >50 dBZ echoes.
- Step down one or two elevation scans, as the storm top may rise or fall over the assessment period.
- Centre cursor on the >50 dBZ core.
- Set a reference point.
- Step forward to the most recent scan
- Place your cursor on the >50 dBZ core.
- Read off the speed and direction off the cursor data window of your radar display software.
Potential Difficulties in Detection
Storms move anomalously for many different reasons. For severity determinations we are looking primarily for storms that propagate anomalously due to updraft interaction with deep-layer vertical shear, so you may need to confirm the storm isnt moving anomalously due to the following reasons:
- Cold pool/shear interactions
- Storm mergers
- Boundaries (drylines, fronts, outflow boundaries)
- Orographic influences
- Radar sampling – The thunderstorm is too close to the radar, therefore the radar undershoots the storm top used for tracking. It may still be possible to use other recognisable features to track the storm
- Short storm history – Storms that have just appeared on radar are too young to allow the determination of a storm motion vector due to lack of past storm locations.
- Very large storms, especially with multiple updrafts – in this situation, it is often difficult to reliably track a persistent feature
Examples of Anomalous Storm Propagation
Loop of a supercell storm splitting into a dominant left–mover and smaller right–mover. Both of these storms move anomalously from steering winds after splitting. It is important to make sure you are tracking the same part of the storm when assessing anomalous storm motion.
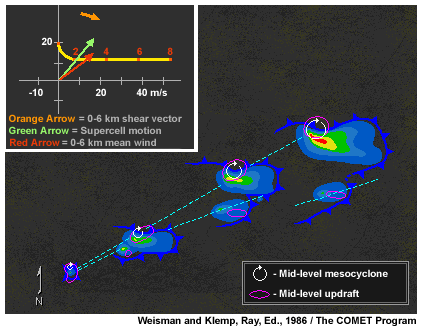
The smaller storms move to the east with the steering flow. The two larger storms, one to the northwest and the other in the south are propagating to the north/northeast, that is to the left of the steering flow vector.
The storms initially move to the east with steering, then propagate to the north (to the left of the steering flow vector).
Anomalous Storm Propagation Look–a–likes
- Elevated core from a separate updraft – More often than not, storms are multicellular in nature with several updrafts co–located in a storm. Sometimes this can lead to mistakenly using different updrafts to calculate the anomalous motion vector.
- Thunderstorms propagating due to reasons other than updraft/deep layer shear interactions, as mentioned above (these include cold pool interactions, storm mergers, boundary interactions, orographic influences).
Conceptual Model
Anomalous storm propagation can be used as one of many signatures increasing the likelihood of a storm being severe. Of most interest here, the presence of anomalous storm motion may indicate that the thunderstorm is supercellular.
Supercells move anomalously to the steering flow due to dynamic pressure perturbations set up by a sheared environment interacting with a strong and persistent updraft. Nonhydrostatic pressure gradient forces promote new updraft growth on preferred flanks of the existing storm. On the upshear side high dynamic pressure forms, and on the downshear side low dynamic pressure forms. This rule of thumb also applies in a directionally varying shear environment. In an anticlockwise hodograph (most common in Southern Hemisphere), a storm–scale perturbation high forms on the left flank of the deep layer shearvector at low levels. At higher levels, a storm–scale perturbation low forms on the left hand side of the deep layer shear vector. The result is an upward directed perturbation pressure gradient force that promotes new development on the left flank of the storm. Meanwhile, the right flank of the storm would experience a downward directed dynamic pressure gradient force weakening or even suppressing the growth or maintenance of updrafts.
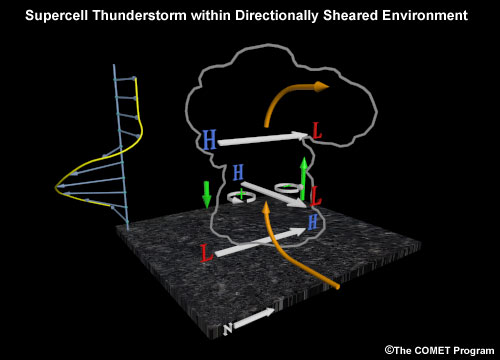
Updraft shear interactions and the resulting perturbation pressures in a shear environment marked by a counter-clockwise hodograph.
Splitting cells may be an early indicator to anomalous propagation. Uniformly splitting cells occur preferentially in unidirectional shear environments (straight hodographs).
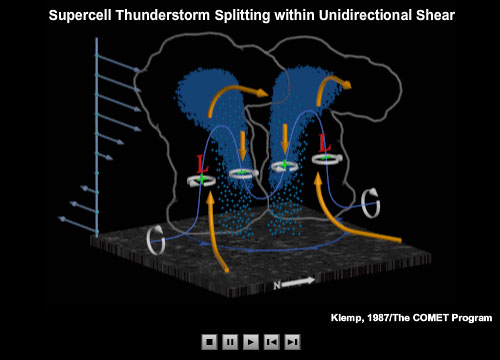
Splitting supercells produced in an environment characterised by a mainly straight hodograph with some anticlockwise curvature in the low levels.
Splitting can still occur in curved hodographs. In an anticlockwise hodograph (typically found in the Southern Hemisphere), a left mover would be dominant and the right mover would likely decay, as explained above.
Splitting supercells produced the shear depicted on the anticlockwise hodograph. The left–mover is dominant while the right-mover usually decays in this situation.
The presence of propagation due to updraft and strong deep layer shear interaction suggests that the thunderstorm is possibly a supercell. Supercell thunderstorms increase the chance of producing any of the four severe weather criteria used to define a severe thunderstorm: damaging or destructive winds, large hail, tornadoes and heavy rainfall resulting in flash flooding.
Determining Thunderstorm Classification
Anomalous storm propagation due to updraft interaction with strong deep layer shear usually is associated with supercells.
To help determine the classification of the thunderstorm you are observing, use the following flow chart to help diagnose which thunderstorm conceptual model you should consider more closely. If you already know the conceptual model to apply, click on the appropriate model at the end of the flow chart.
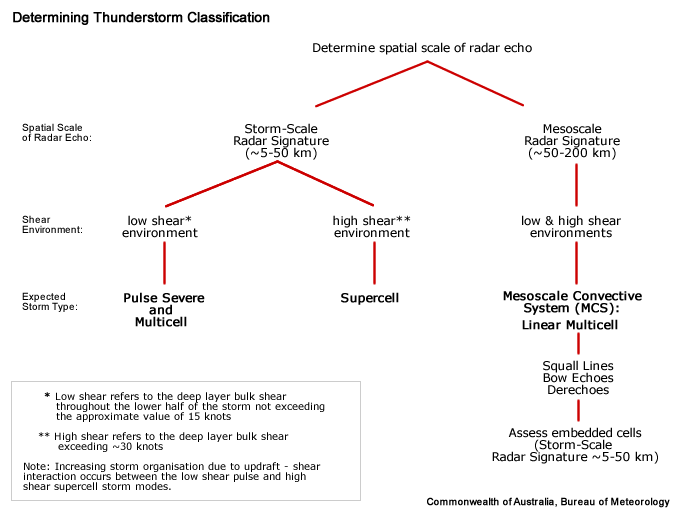
See Supercell for more information.
Diagnosis
Once you have confidently identified an anomalous storm motion signature, this section will help you estimate the storm severity associated with it. Generally, the spatial and temporal scales of a signature are loosely related to the updraft strength. In other words, the larger and/or more long–lived the signature, the stronger the updraft that produced it. In velocity-based signatures, updraft severity can usually also be gauged by the magnitude of the measured radial velocities. Examining a storms overall temporal evolution will suggest whether the storm is becoming more or less severe. Radar signatures and associated storm developments can also be time-shifted relative to each other, as is the case in supercell tornadoes that occur during the collapse of the parent storm.
When comparing signatures to diagnose relative severity, keep in mind that it is assumed that signatures are sampled at equal ranges from the radar. Otherwise, a storm sampled at greater range (with a wider beam) can appear to be weak and/or weakening, while a storm sampled at a closer range (with a narrower beam) can appear to be strong and/or strengthening.
Degree of Severity
Anomalous storm motion can be an anomaly in speed, direction or both. The amount of deviation of the storm motion vector from the steering flow can indicate the severity of the storm. This can be explained through storm-relative helicity arguments. The shaded polygon in Example 1 is bounded by the tip of the storm motion vector and the hodograph itself between the surface and the top of the storm's inflow layer (often the 0-3 km layer). This area is a measure of the storm relative helicity (SRH) or alternatively the amount of useable "streamwise" vorticity that is ingested by the storm. Usually the more "off the hodograph" a storm moves, the more storm relative helicity the storm ingests through its low–level inflow. Therefore, the storms low-level rotational potential increases. The hodographs below illustrate these principles.
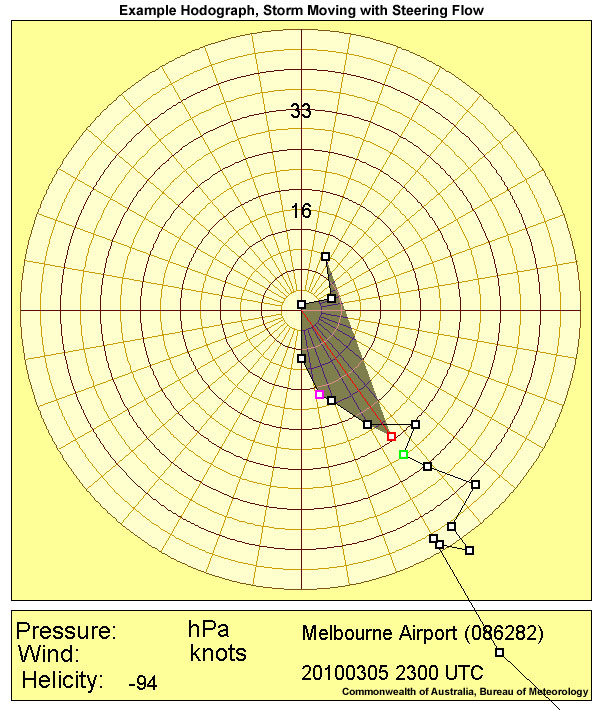
Here, a storm moves purely with the steering flow (red line and square shows the storm motion vector) and is associated with SRH (shaded area) of approximately –94 m2/s2
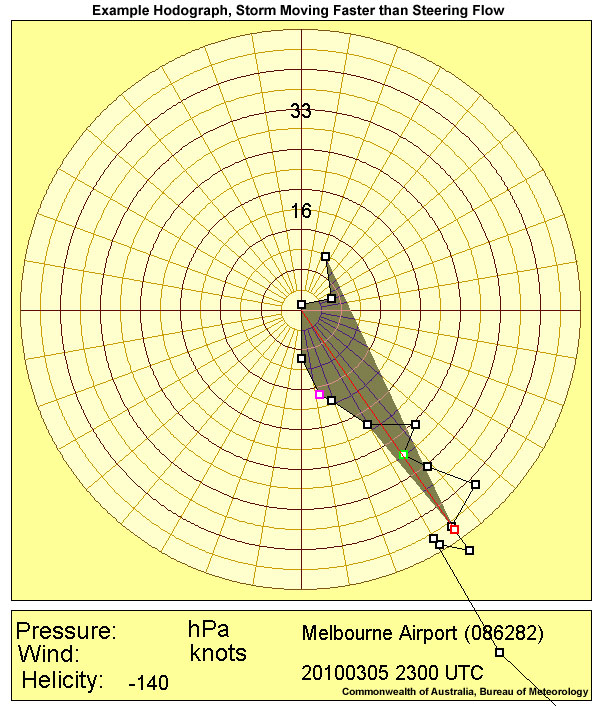
A storm (red box) is moving 16 kts faster than steering flow, resulting in a higher SRH (shaded area) of approximately –140 m2/s2
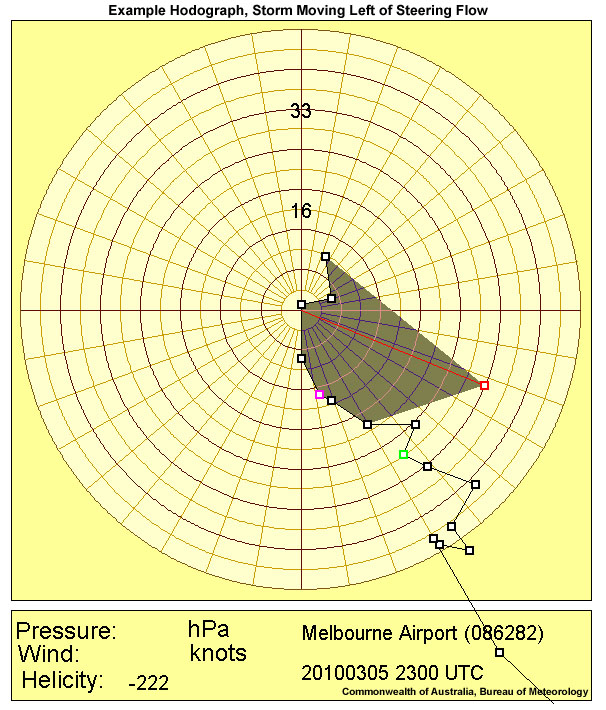
The most dramatic increase in SRH in the presence of a counter–clockwise curving hodograph is achieved for a left–moving storm, like the one given here, with a motion 16 kts to the left of steering and a SRH of approximately –222 m2/s2
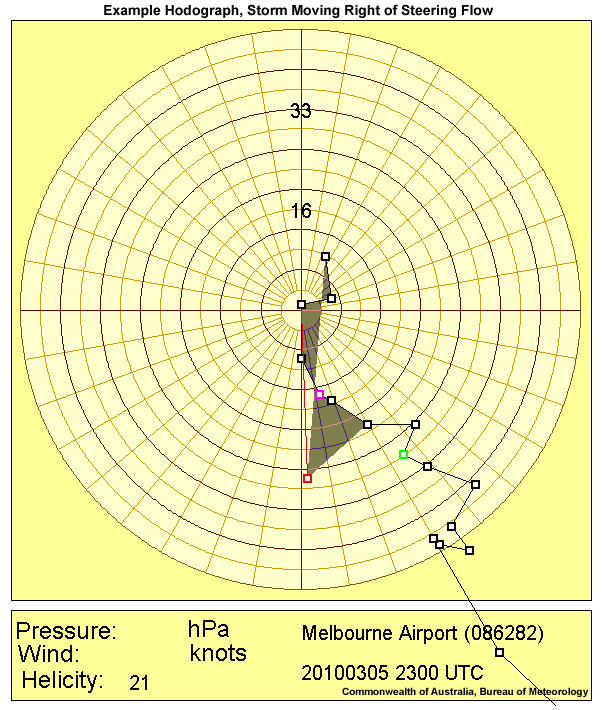
A right-moving storm in a counter-clockwise curving hodograph environment, might experience much lower SRH values, such as the storm above that is moving at 16 kts to the right of steering with a SRH of 21 m2/s2. Such a situation should increase its probability of demise, or at least a lower its potential for intensification. For a clockwise curving hodograph, conversely, a right-moving storm would experience the highest SRH values, and left-moving storms would be less likely to survive.
Bunkers et al. (2000) determined, after investigationg 290 supercell hodographs, that a correction vector added to the steering flow and which measures the amount that storms deviate from the 0–6 km mean wind (steering wind), ranges between 3 ms-1 to 16 ms-1. Therefore, based on these results, a deviation of ~7.5 ms-1 is used to estimate future supercell motion. In general, it is not clear why some supercells deviate significantly from the mean wind, while others do so to a much lesser degree. Reasons for the deviations from the mean winds by more than 10 ms-1 might be related to both the effects of the storm outflow and interactions of the storm and its cold pool with pre-existing atmospheric boundaries (Bunkers et. al., 2000).
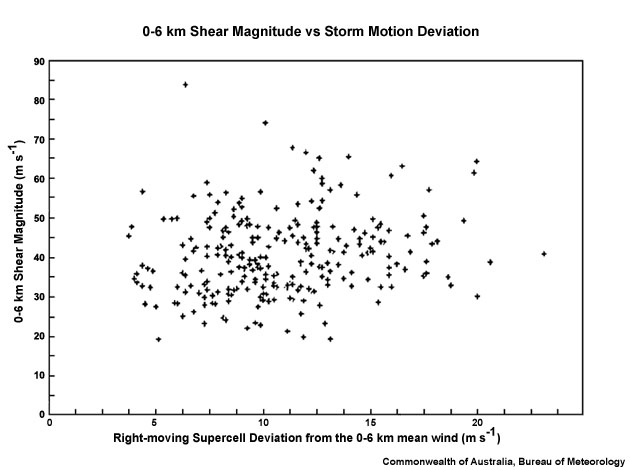
A US climatological study relating 0–6 km shear magnitude with the amount that right–moving supercells deviate from the steering flow (Bunkers, 2000).
Considering all these aspects of updraft/deep-layer shear interaction propagation will help determine whether you are dealing with a significant signature. Anomalous propagation is one of the few signatures that could influence you directly into issuing a severe thunderstorm warning, based on the tight connection to supercellular charactersitics via the helicity ingestation process. However, radar information should never be used in isolation and should always be used in conjunction with the near storm environment and any reports.
Most Likely Convective Hazards
If a thunderstorm has been determined to be severe and moves anomalously to steering flow, the following severe convective hazards should be considered for inclusion in the severe thunderstorm warning:
- Damaging winds – supercell
- Large hail – supercell
- Heavy rainfall resulting in flash flooding – supercell
- Tornadoes – due to supercellular classification, tornadoes are possible but additional consideration to the environment is required. Look for more evidence, such as strong 0 – 1 km shear and low Lifted Condensation Levels (LCLs).
See Conceptual Models for more details on why particular severe weather should be included.
References/Addendum
Bunkers et al., 2000: Prediciting Supercell Motion Using a New Hodograph Technique.Weather and Forecasting 15 pg 61-79.