«- back to print version table of contents
Mid-level Mesocyclone
Detection
A mid-level mesocyclone is a storm-scale (2-10 km in diameter) vortex, usually cyclonic, in the mid-levels of a convective storm that satisfies the mesocyclone intensity and spatiotemporal extent criteria listed below. In this resource, "midlevels" is defined as the section of a deep convective storm that is approximately halfway between the base and the top of the thunderstorm. The mesocyclone also is required to be in the vicinity of or collocated with a deep convective updraft.
For the rotation to be classified as a mesocyclone, the vortex generally needs to possess the following characteristics that have been used as quantitative criteria by the US National Severe Storms Laboratory and National Weather Service:
- Duration – signture is evident on at least 2 successive 10 minute radar volume scans
- Horizontal Size – signature is 2-10 km in diameter
- Vertical Size– signature is at least 3 km in vertical depth
- Intensity– signature shows rotational velocity of at least 15 ms-1, or vertical vorticity on the order of 10-2 s-1 or higher
- Location– signature is located in the vicinity of a deep convective updraft
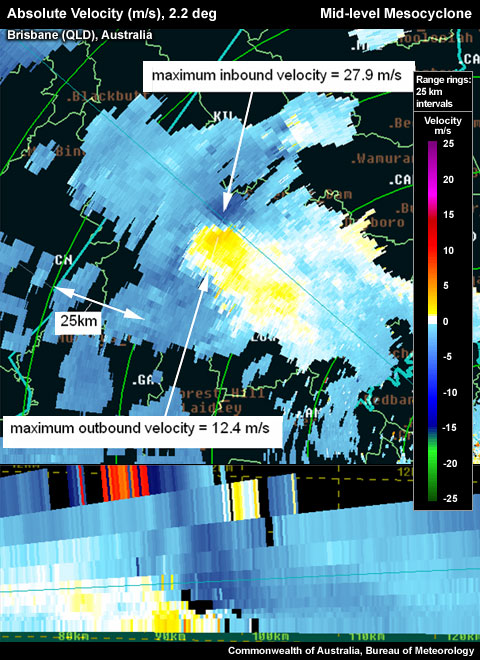
Clockwise mid–level mesocyclone with clear inbound/outbound couplet.
To detect a Mid-level Mesocyclone signature, use the following techniques:
Reflectivity: PPI/Plan View
Determining updraft location:
- Step up in elevation scans until you run out of >50 dBZ echoes.
- Step down one elevation scan.
- Centre cursor on the upshear side of the > 50 dBZ core. Note: This is to account for storm movement in strong winds aloft, which results in core movement between the lowest and storm top–level radar scans.
- Set a reference point.
- Step down to the midlevels of the thunderstorm. The reference point should be at the location where a mesocyclone would be expected. Now switch to velocity data
Velocity: PPI/Plan View
In the vicinity of the reference point, look for local maxima in the inbound and outbound radial velocities close to each other. Both velocity maxima should be at about the same range from the radar. Depending upon the component of the storm motion towards/away from the radar, the rotation may not be displayed as a symmetric inbound/outbound couplet, but may show a possibly highly asymmetric couplet. Even without any storm motion, or in a storm-relative frame of refrence, mesocyclones rarely manifest themselves as fully symmetric couplets. See the examples section for a demonstration of this couplet asymmetry.
Potential Difficulties in Detection
- Radar Sampling
- Aliasing–radial velocity values that exceed the radars Nyquist velocity, VN, are remapped to fictitious new radial velocities that fit within the interval ± VN. Once remapped, these velocities are considered "aliased" and their new appearance can easily mask the standard inbound/outbound velocity couplet of a mesocyclone, as shown in the example below.
Cyclonic (clockwise in the southern hemisphere) mesocyclone with aliased outbound velocity – the aliased outbound pixels appear in dark blue instead of red or violet.
-
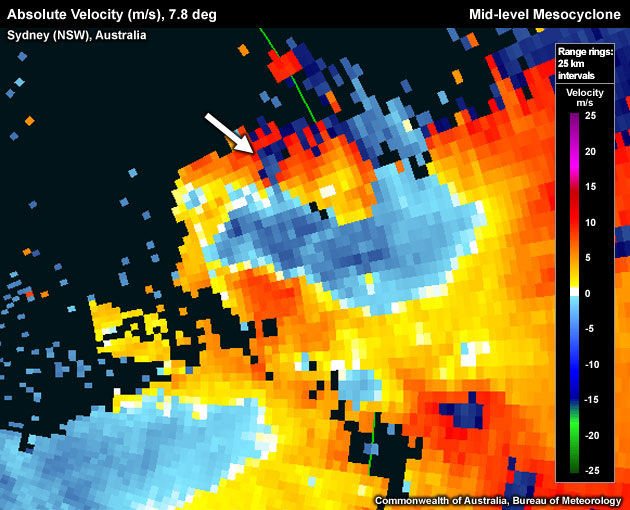
- Rapidly translating mesocyclones–when either the storm is moving fast or there is a strong background flow, a mesocyclone signature might be hard to recognise due to the often asymmetrical inbound/outbound couplet. In some cases the entire signature may be all outbound (inbound) when it moves rapidly away from (toward) the radar. The signature may be composed, for example, of very strongly outbound velocity next to less strongly outbound velocity.
- Poor velocity data– confidence in pixels, especially extreme values, are lowered. "Hot pixels" are possible due to unfolding algorithm failures for radars that run dual pulse repetition frequencies. A check for spatial and temporal continuity can identify most velocity data contaminations of this type.
- Beam Height– if a thunderstorm is far from (close to) the radar, it becomes increasingly likely that the radar beam will overshoot (undershoot) the midlevel mesocyclone.
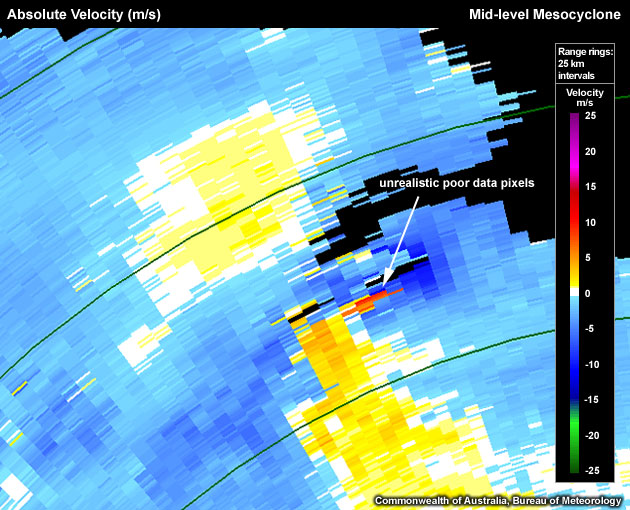
Cyclonic midlevel mesocyclone with unrealistic orange/red poor data pixels. Stepping up and down in elevation as well as forwards and backwards in time would reveal that these "hot pixels" suddenly appear and disappear, strongly indicating that their origin is unphysical.
- Resolution degradation as:
- Range increase– radar sampling degrades due to increasing beam width, which increasingly smoothes out any sharp velocity gradients in the mesocyclone
- Mesocyclone size decreases– radar sampling of the mesocyclone degrades for the same reason as above. "Mini-supercells" are particularly prone to this type of sampling problem.
- Timing of radar sampling– a mesocyclone could exist for nearly 20 minutes and only be captured on 1 scan, if 10 minute volume scans are used
Examples of Mid0level Mesocyclones
Use the radio buttons or click the image to switch between reflectivity and velocity imagery:
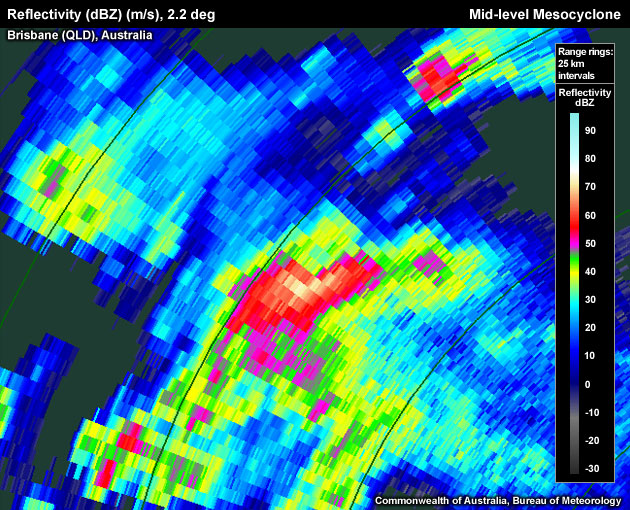
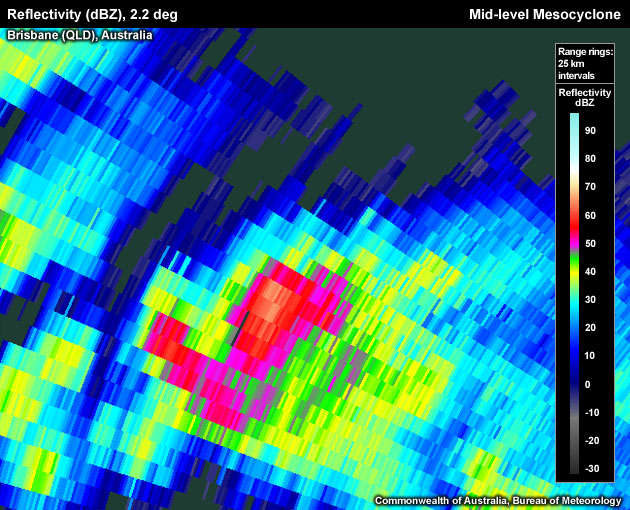
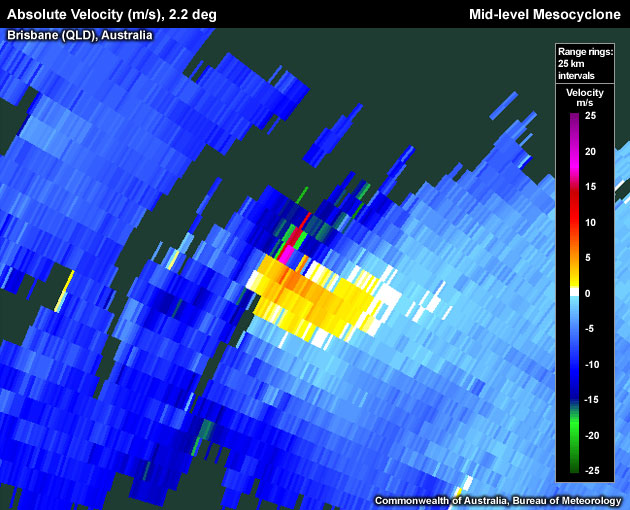
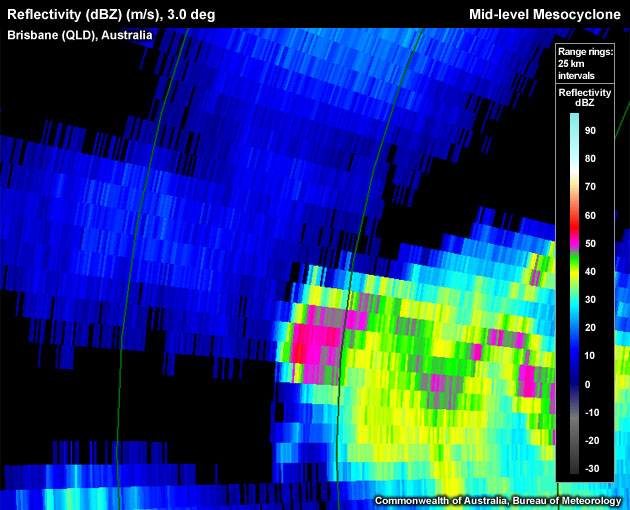
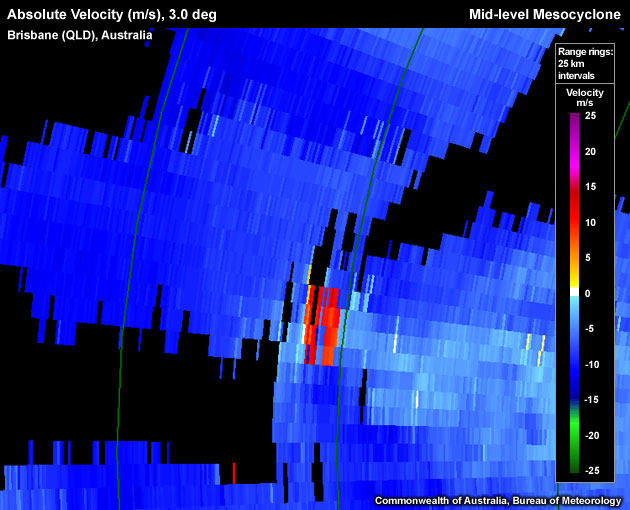
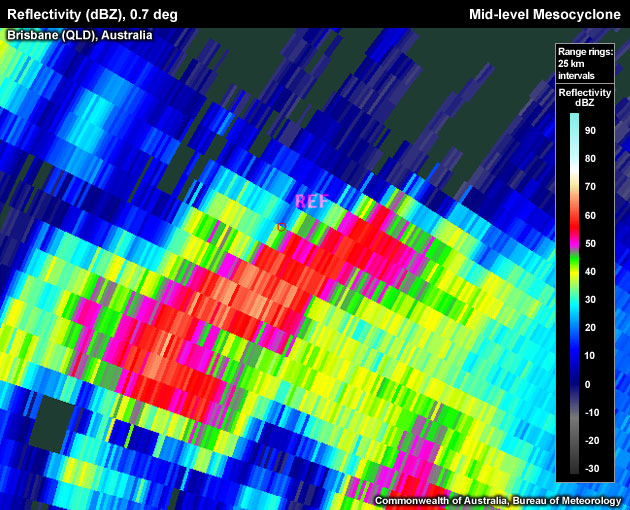
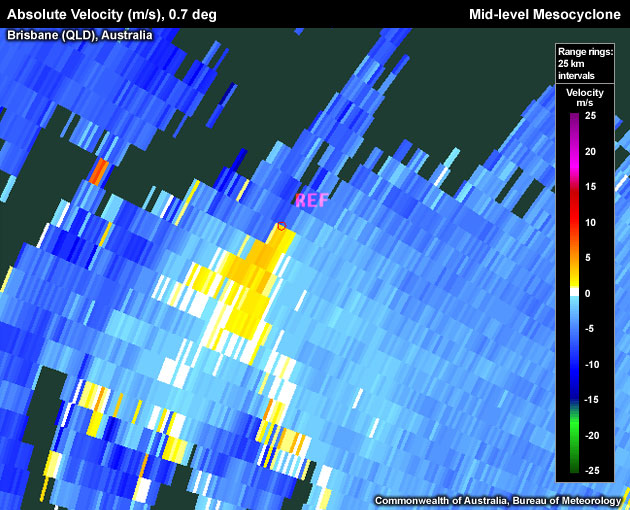
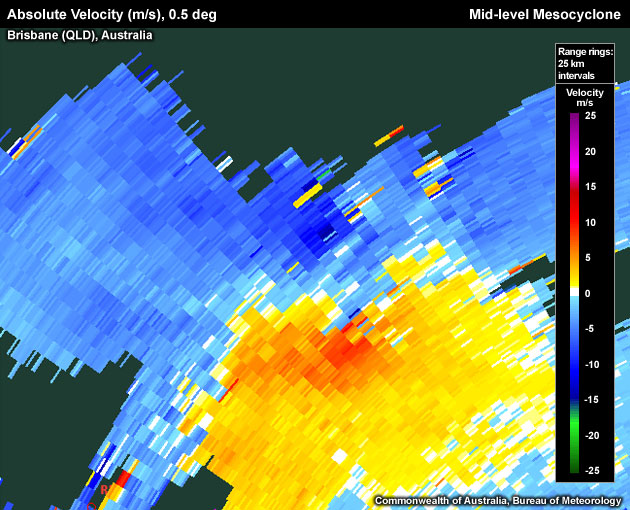
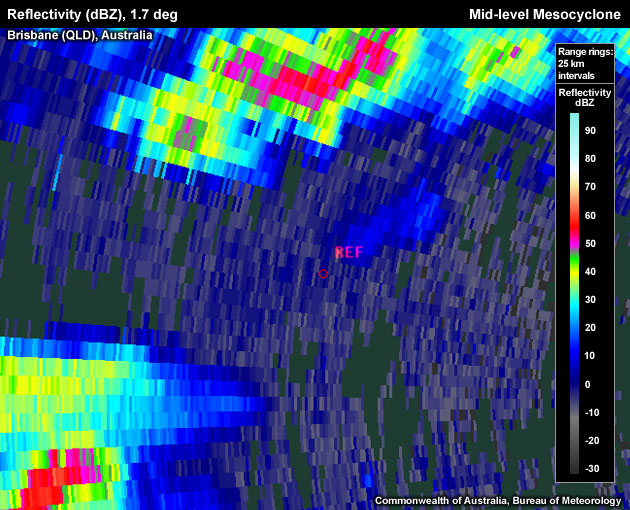
Very broad "hook", evident in the reflectivity, co-located with a broad low-level mesocyclone (oval) seen in the velocity field at the same elevation.
Use the radio buttons or click the image to switch between reflectivity and velocity imagery:
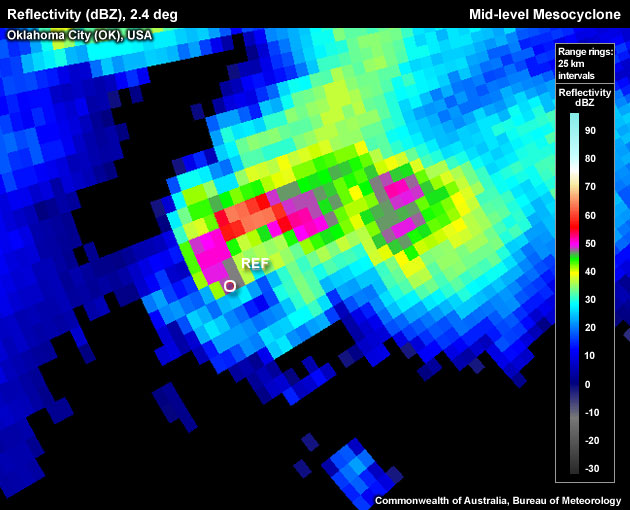

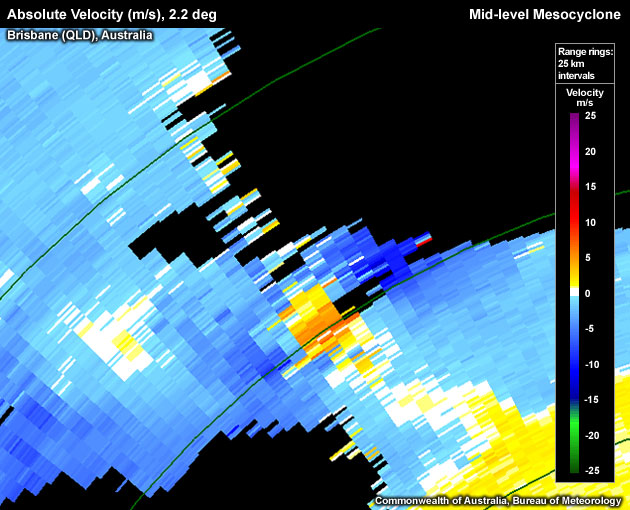
Northern hemisphere cyclonic (counter-clockwise) mid-level mesocyclone associated with a young supercell southwest of Oklahoma City on 3 May 1999. The mesocyclone is translating rapidly towards the radar, which leaves the inbound (southern) branch strongly aliased into the positive reds, while the outbound (northern) branch shows only very weak outbound base velocities. Note that the circulation centre is located at the tip of a deep hook echo on the storm's southwestern flank.
Use the radio buttons or click the image to switch between reflectivity and velocity imagery:
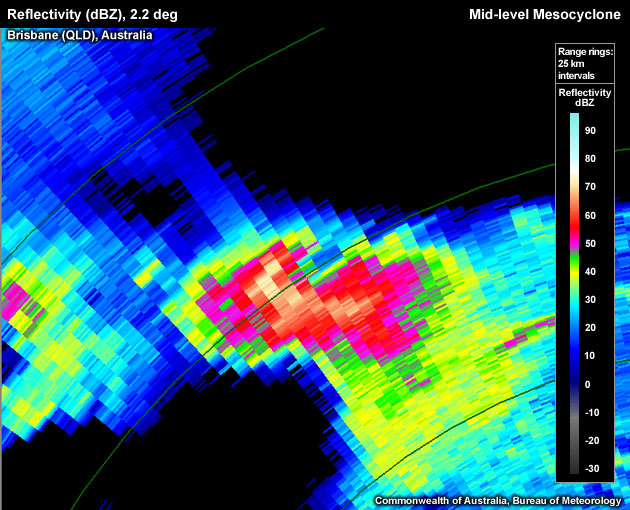
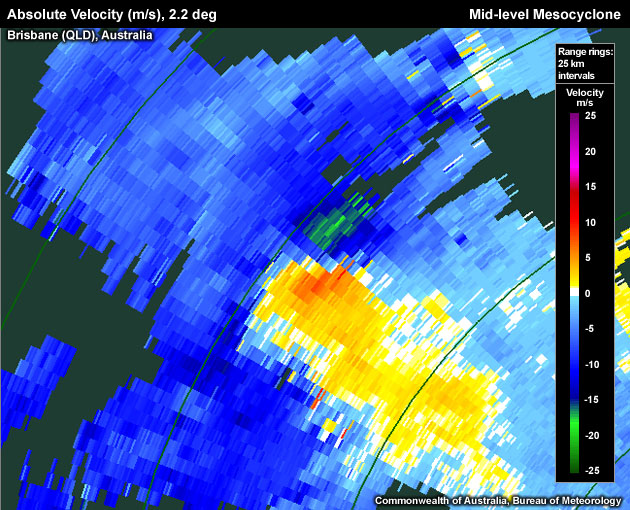
Cyclonic mid-level mesocyclone (southern hemisphere) collocated with a BWER on the northern flank of this supercell. Note the Three Body Scatter Spike (TBSS) in the reflectivity image. (Note: there is a slight discrepancy in the zoom level between these two images.)
Use the radio buttons or click the image to switch between reflectivity and velocity imagery:
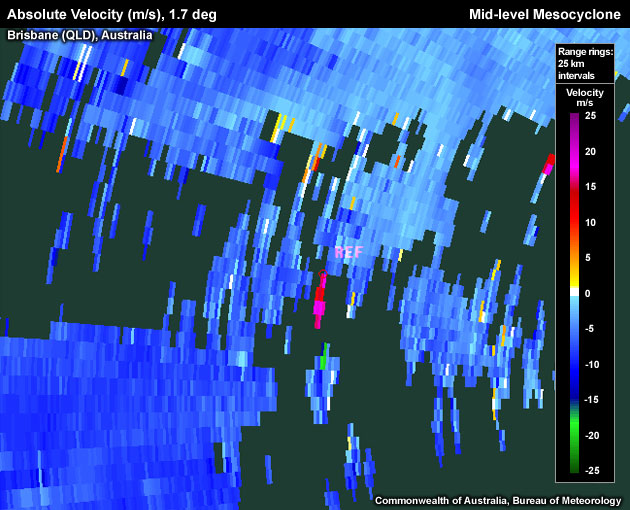
Cyclonic mid-level mesocyclone (SH) "hot" orange and red pixels; these pixels first give the impression of aliased or folded velocity data, but an inspection of surrounding scans in space and time suggest poor velocity data. The mid-level mesocyclone centre is located on the northern flank of the storm, rather than inside the weak echo region to the southwest, due to a new strong updraft at this location.
Mid-level Mesocyclone Look–a–likes
- Poor Velocity Data – most Australian Doppler radars scan using two pulse repetition frequencies (dual PRT) in order to increase their Nyquist velocity. Velocity data can therefore be affected by the performance of the unfolding algorithm, occasionally producing extreme values that are false. The example below shows light blue pixels moving straight into red values, which is too large an acceleration over a very short distance to be realistic. The reflectivity data also suggests a rather non-severe looking cell.
Use the radio buttons or click the image to switch between reflectivity and velocity imagery:
Corrupted velocity pixels that do not indicate rotation. Step forward/backwards as well as up/down in elevation angle to confirm that this feature has no temporal or spatial continuity.
- Weak shear – The rotational velocity is weaker than the thresholds for a minimal mesocyclone, and would be classified in the "weak shear" regime of the rotational velocity and radar range nomogram discussed in the Diagnosis section.
Use the radio buttons or click the image to switch between reflectivity and velocity imagery:
An intensifying storm shows a cyclonic circulation with outbound velocities of approximately 6 m/s and inbound velocities of approximately 13 m/s. These values are insufficient to classify the couplet as a mesocyclone.
- Divergence/Convergence – these can sometimes be confused with rotation. Note the white isodop between the divergence or convergence signature.
Clockwise midlevel circulation that contains a strongly convergent component.
- Signature not collocated with an updraft – A true mesocyclone must be identified as storm-scale rotation in close proximity to an updraft.
Use the radio buttons or click the image to switch between reflectivity and velocity imagery:
The velocity panel shows what could be mistaken for a small but intense clockwise circulation near the center of the image. The corresponding reflectivity panel confirms that the possible circulation is a radar artefact.
- Limited vertical extent ("single level vortex") – by definition, a vertical extent of approximately 3 km or more is required for a true mesocyclone.
- Circulation diameter is too large – a broad area of rotation exceeding the 2 – 10 km range is more likely the result of processes occurring on a scale larger than that of tilting of horizontal vortex lines by an updraft.
Use the radio buttons or click the image to switch between reflectivity and velocity imagery:
A broad area of cyclonic shear extending through the entire northern flank of a storm.
- Signature not persistent – A signature must be evident for at least 10 minutes to be classified as a mesocycone.
Conceptual Model
A mid-level mesocyclone is usable as the defining radar signature for a supercell thunderstorm. The presence of a mid-level mesocyclone indicates small-scale rotation in the vicinity of or inside a storms updraft. This rotational flow is associated with the presence of vertical vorticity which has been created through tilting of ambient horizontal vorticity (inherent in environmental vertical shear) by a strong convective updraft and subsequently stretched due to vertically accelerating parcels in the updraft. For a more complete description of these processes, see the Supercell Conceptual Model.
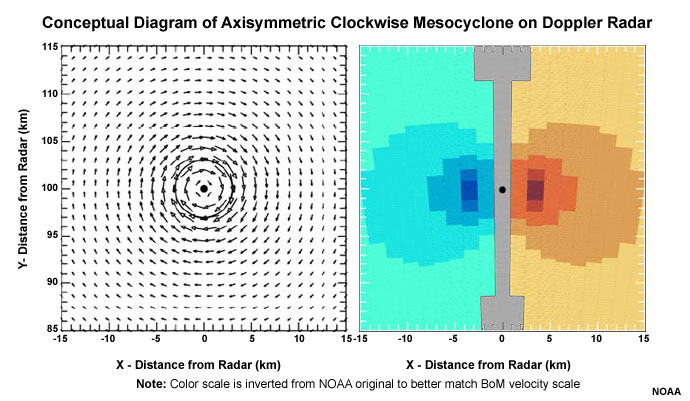
Doppler velocity pattern of a typical southern hemisphere mesocylcone (clockwise circulation) that has peak tangential velocities of 25 m/s (49 kt) at a radius of 3 km from the circulation center (black dot); radius of maximum winds is indicated by circle. Arrow length is proportional to wind speed. The image on the right shows how this circulation would appear in the base velocity of a Doppler radar.
A persistent Mid-level Mesocyclone signature indicates a strong and reasonably steady rotating updraft associated with a supercell. Generally, supercells can produce all four of the severe convective hazards used to define a severe thunderstorm in Australia, with large hail and damaging winds being the most likely to occur. Many studies since the 1970s, including a climatology of US events from 2007, conclude that supercells produce severe weather far more frequently than other morphologies, and also produce more intense severe weather (e.g., Duda & Gallus, 2010).
Although the presence of a mesocyclone is associated with a risk that the parent storm may produce a tornado, recent studies have found a relatively low correlation between midlevel mesocyclone detections and observed tornadoes. Trapp et al. (2005) found that only around 15% of midlevel mesocyclone detections were tornadic. In contrast, early research from the 1970s initially suggested that as many as 50% of radar detected mesocyclones were tornadic.
Essential in the assessment of tornado potential is a consideration of the near-storm environment, particularly the vertical wind shear and relative humidity in the 0–1 km layer (Thompson 2003; Craven and Brooks 2002). Additionally, evidence of a low–level mesocyclone is more relevant for tornado potential than consideration of midlevel mesocyclones.
Determining Thunderstorm Classification
A significant, persistent mid-level mesocyclone is, by definition, part of a supercell. Generally, to help determine or confirm the classification of the thunderstorm you are observing, use the following flow chart to help diagnose which thunderstorm conceptual model you should consider more closely.
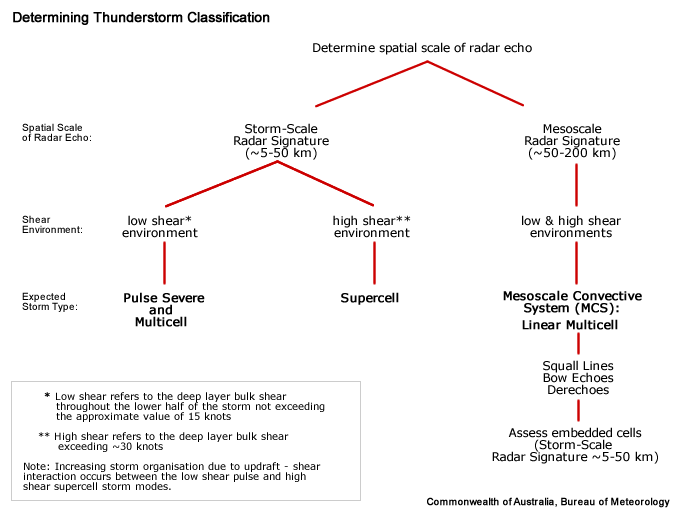
See Supercell for more information.
Diagnosis
Once you have confidently identified a Mid-level Mesocyclone signature, this section will help you estimate the storm severity associated with it. Generally, the spatial and temporal scales of a signature are loosely related to the updraft strength. In other words, the larger and/or more long–lived the signature, the stronger the updraft that produced it. In velocity-based signatures, updraft severity can usually also be gauged by the magnitude of the measured radial velocities. Examining a storms overall temporal evolution will suggest whether the storm is becoming more or less severe. Radar signatures and associated storm developments can also be time-shifted relative to each other, as is the case in supercell tornadoes that occur during the collapse of the parent storm.
When comparing signatures to diagnose relative severity, keep in mind that it is assumed that signatures are sampled at equal ranges from the radar. Otherwise, a storm sampled at greater range (with a wider beam) can appear to be weak and/or weakening, while a storm sampled at a closer range (with a narrower beam) can appear to be strong and/or strengthening.
Degree of Severity
Mesocyclone severity has been studied extensively since the 1970s. A nomogram (developed by David Andra and others within the WSR–88D Operational Support Facility [OSF]) normalises the observed rotational velocity for range from the radar assuming the following characteristics of the radar and mesocyclone:
- the mesocyclone can be approximated by a Rankine combined vortex
- the signature has a diameter of approximately 6.5 km
- the radar has an effective half power beamwidth of 0.9 degrees
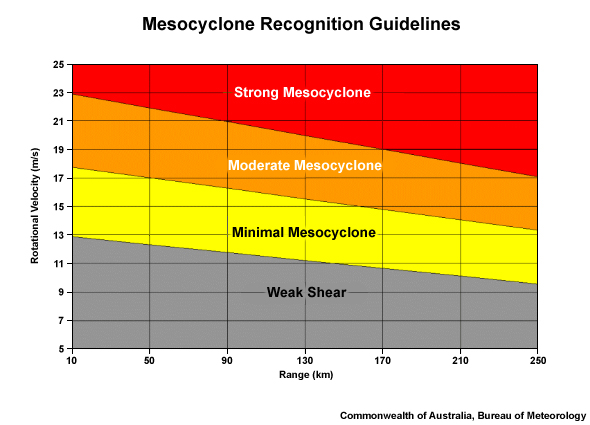
OSF 6.5 km mesocyclone nomogram classification (Andra, 1997). This crude guide is of particular value to forecasters inexperienced in the determination of mesocyclone strength and is merely a starting point.
To determine the mesocyclone strength, use Doppler radar to:
- Read off the maximum inbound and outbound velocities (e.g., inbound value of –25 ms-1 and outbound value of +15 ms-1). In the event that the velocity couplet has no sign reversal (i.e., both velocity extrema in the couplet are either inbounds or outbounds), read off both extreme values (e.g., outbounds of 35 ms-1 and 5 ms-1).
- Add the magnitudes of the two values together and divide by 2 to obtain the rotational velocity strength. The first example in above yields a rotational velocity Vr = (|–25|+15)/2 ms-1 = 20 ms-1. For the second case above,Vr = (35 + 5)/2 ms-1 = 20 ms-1.
- Determine the range of the mesocyclone centre from the radar (in km).
- Using the rotational velocity and the range from radar, read off the strength of the mesocyclone in the nomogram
One limitation to the mesocyclone nomogram is that it is specific to 6.5 km diameter. It is important to be aware of this limitation as the nomogram could grossly under- or over- estimate the intensity of the mesocyclone in those cases where the mesocyclone has a diameter significantly smaller or larger than 6.5 km.
After classifying the strength of the mesocyclone, make sure the radar–detected rotation meets the remainder of the mesocyclone criteria:
- Diameter < 10 km
- Vertical extent > 3 km
- Persistence > 10 minutes
The mesocyclone strength nomogram is a subjective classification tool for assessing the strength of the mesocyclone. A mid-level mesocyclone is one of the few signatures that effectively require you to issue a severe thunderstorm warning, based on the direct reading of the mesocyclone strength and connection to a supercell thunderstorm. In general, however, radar information should never be used in isolation and should always be considered in conjunction with the near storm environment and any reports.
Most Likely Convective Hazards
If a thunderstorm has been determined to be severe and possesses a mid-level mesocyclone, the following convective hazards should be considered to be included in the severe thunderstorm warning:
- Destructive winds – a mesocyclone is a proxy for a supercell thunderstorm with potential to produce a very strong downdraft. Destructive winds should be considered over damaging winds due to the supercellular classification, except if you can confidently diagnose an elevated supercell. Elevated supercell downdrafts are usually well–insulated from the surface by a deep layer of potentially cold air.
- Large hail – a particularly strong updraft has the potential to produce large hail, providing the updraft extends into the hail growth layer, –10° to –30°C. Some consideration to giant hail should be taken due to the supercellular classification of the thunderstorm.
- Heavy rainfall resulting in flash flooding – flash flooding is not an automatic hazard associated with supercells, particularly for smaller or faster–moving storms. Supercells tend to have a comparatively low precipitation efficiency, but also process inordinate amounts of water vapour. The result of these two opposing drivers for heavy rainfall is that flash flooding is more likely with larger and/or slower–moving supercells.
- Tornado – only about 15% of midlevel mesocyclones are associated with tornadogenesis, based on Trapp et al.(2005). The risk of a supercell tornado should, however, be considered, especially in environments with high relative humidity in the boundary layer and strong 0–1 km shear.
See Conceptual Models for more details on why particular severe weather should be included.
References/Addendum
Andra, D. L., 1997: The origin and evolution of the WSR–88D mesocyclone recognition nomogram. Preprints, 28th Conf. on Radar Meteorology, Austin, TX, Amer. Meteor. Soc., 364–365.
Duda, J.D. and W.A.Gallus Jr., 2010: Spring and Summer Midwestern Severe Weather Reports in Supercells Compared to Other Morphologies. Weather and Forecasting 25 pg 190-206.
Jones, T.A. et. al., 2004: Association between NSSL Mesocyclone Detection Algorithm-– Vortices and Tornadoes. Weather and Forecasting, 19,872-890.
Thompson, R. L., R. Edwards, J. A. Hart, K. L. Elmore and P. Markowski, 2003: Close Proximity Soundings within Supercell Environments Obtained from the Rapid Update Cycle. Wea. Forecasting, 18, 1243-1261.
Trapp, R. J. et al., 2005: A Reassessment of the Percentage of Tornadic Mesocyclones. Weather and Forecasting, 20,680-687.