Downdraft Strength: Importance and Contributions - 2
In general, it is difficult to anticipate the net contributions to downdraft strength from precipitation loading. However, we can make some reasonable estimates of the potential contributions from evaporative cooling by again viewing the environmental sounding.
View each of the examples of estimating downdraft potential.
Example 1
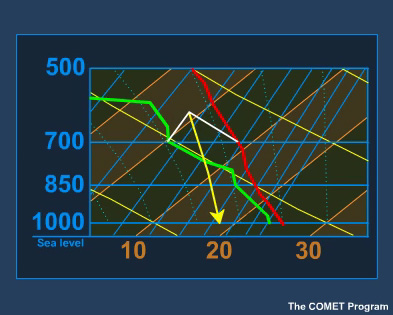
Usually the downdraft originates near the level of minimum wet-bulb potential temperature, 3-5 km above the ground. In this example we assume that the downdraft originates at 700 mb and that parcels from this level remain saturated all the way to the surface and do not mix with updraft air.
We can estimate the downdraft parcel's path by determining its wet bulb temperature, and then, from that temperature, following a moist adiabat to the surface. On the skew-T diagram, we determine the wet-bulb temperature by lifting the parcel along a dry adiabat to saturation. From that point, it is an easy matter to follow a moist adiabat to the surface. In the example shown here, we can see that the parcel remains cooler than the environment throughout its descent and thus accelerates downward.
DAPE, a downdraft equivalent of CAPE, can be calculated by integrating the negative temperature perturbations over the depth of the downdraft path.
Example 2
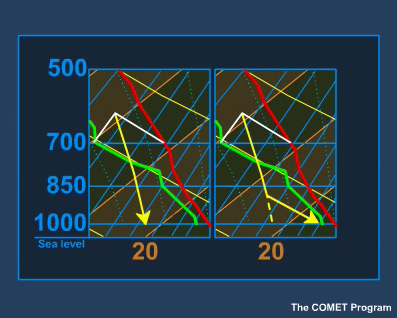
Wet-bulb potential temperature gives us an estimate of the MAXIMUM cooling the parcel would experience. Cooling may be less if the parcel does not experience evaporation all the way to the surface. It would then follow the dry adiabat, rather than the moist adiabat.
Example 3
If the mid-level air was more moist, the wet-bulb potential temperature would be higher, and the potential cooling and downdraft strength would be less. This would also be the case if downdraft air mixed with warmer, moist updraft air.