The Skew-T Diagram
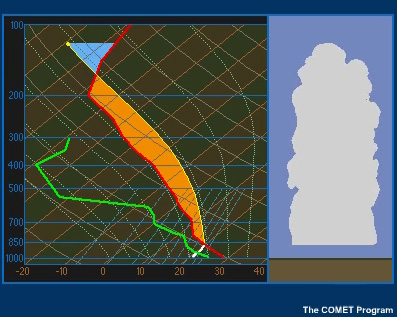
So what makes a parcel of air buoyant? We know that a parcel of air that is warmer than its environment will rise. As an unsaturated air parcel located near the surface rises, its temperature will follow a dry adiabat. Its dewpoint will follow a constant mixing ratio line. Where the dry adiabat crosses the constant mixing ratio line, the air becomes saturated and condensation commences. This is the lifted condensation level, or LCL. As the parcel continues to rise, it follows a moist adiabat. As a result, the rising air parcel becomes warmer and less dense than the surrounding air. So long as the ascent path along the moist adiabat is warmer than the environment, the air parcel will remain less dense than its surroundings and will continue to rise. This condition is referred to as instability. If there is no convective inhibition blocking the ascent of the rising air parcel, as shown in this example, the lifted condensation level becomes the level of free convection, or LFC. In the presence of convective inhibition, the level of free convection may be higher than the lifted condensation level, but never lower. Convective inhibition is discussed later in the module.
The best prognostic tool that forecasters can use to anticipate the potential strength of buoyancy processes is a thermodynamic diagram such as the skew T-log p diagram. By following appropriate parcel ascent and descent curves, a forecaster can use a skew-T diagram to estimate the potential strength of both updrafts and downdrafts for a convective cell. We explore these methods later in the module.