Conceptual Model
A Tight Low-level Reflectivity Gradient on the inflow flank is used as one of many signatures pointing towards a severe thunderstorm. The presence of a tight gradient indicates that large hail and/or heavy rainfall is sharply separated from the low–level updraft. The gradient is caused by size sorting of precipitation and the inflow preventing descent of precipitation into the inflow and updraft, suggesting the presence of a strong updraft and a strong downdraft. This increases the chances of occurrence of all four convective hazards, especially large hail and damaging winds.
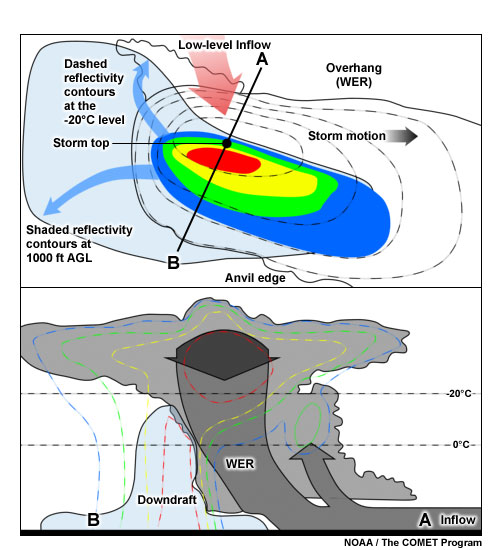
A conceptual model of the structure of a weak echo region within a thunderstorm. The top image shows a plan view of the storm at low level (shaded reflectivity contours) and the –20°C level (dashed reflectivity contours). The blue arrows represent the upper divergence. The red arrow represents the inflow. The lower image shows a cross section of the storm, with the reflectivity contours dashed. The grey arrows represent the updraft with the blue shaded region the downdraft.
Determining Thunderstorm Classification
To help determine the classification of the thunderstorm you are observing, use the following flow chart to help diagnose which thunderstorm conceptual model you should consider more closely.