
Detection
A Weak Echo Region (WER) refers to an area of weak radar returns at low levels on the inflow side of a thunderstorm. A WER is bounded by stronger radar echoes above and on one side. In low-level PPI scans, the WER is often associated with a concave strong reflectivity gradient on the low-level inflow side. A WER is bounded by stronger echoes only on one side. If a WER is bounded by stronger echoes on more than one side, or is surrounded by stronger echoes, the signature is referred to as a BWER (Bounded Weak Echo Region).
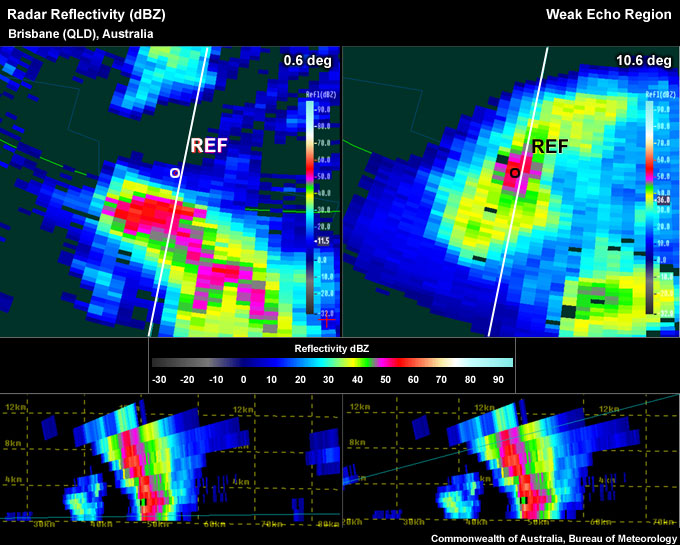
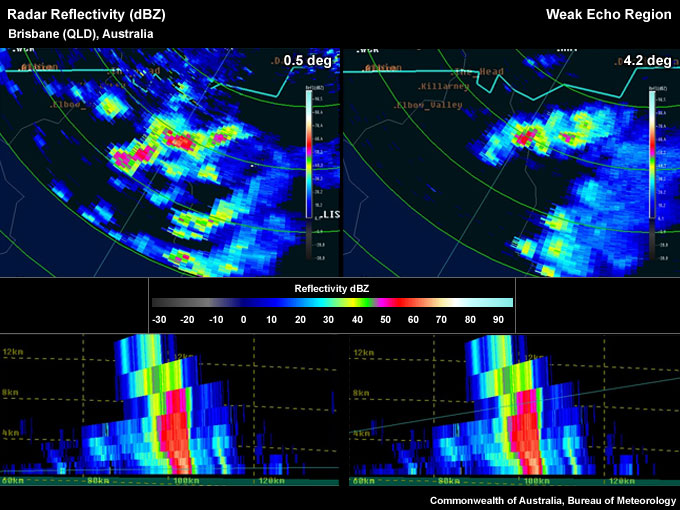
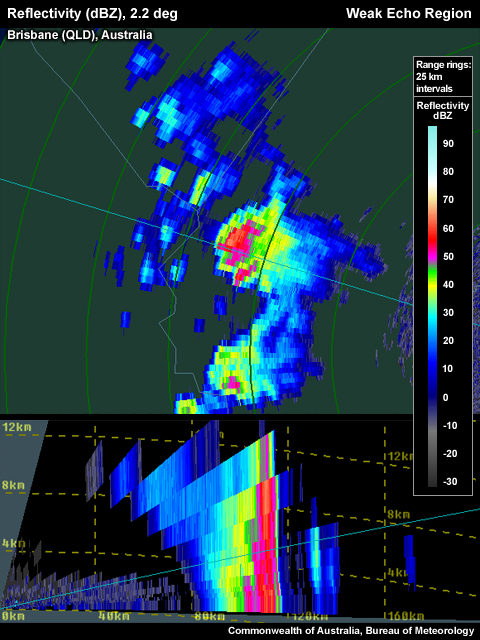
The lowest elevation scan of a storm on the PPI (left) and a PPI at the storm top level (right). A reference point marking the storm top location is located well north of the low level core. The WER can also be seen in the RHI display, under the sloping reflectivity core.
To determine if the signature you are seeing is a Weak Echo Region, use the following approach:
Reflectivity: PPI/Plan View
Determining the inflow/updraft location:
- Step up in elevation scans until you run out of >50 dBZ echoes.
- Step down one elevation scan.
- Centre cursor on the upshear side of the 50 dBZ+ core (this is to account for storm movement between the low-level and high-level radar scans in the presence of strong winds aloft).
- Set a reference point (this marks the approximate storm top).
- Step down to the lowest elevation scan.
- Is the reference point on the edge of the lower core or outside the core altogether? (see example above) If yes, a WER is present.
Note: It is possible to find more than one WER, in such cases as a splitting cell or a multicellular system.
Reflectivity: RHI/Cross-Section
- Follow steps 1-5 from Reflectivity: PPI/Plan View (see above)
- Choose the most direct cross section from the reflectivity core at the lowest tilt to the reference point you set in the upper levels, representing the upper level core. Note: You may need to use an arbitrary (rather than a radial) cross section if you cannot place a standard radial line (originating at the radar location) through the storm top marker and the nearest low-level core.
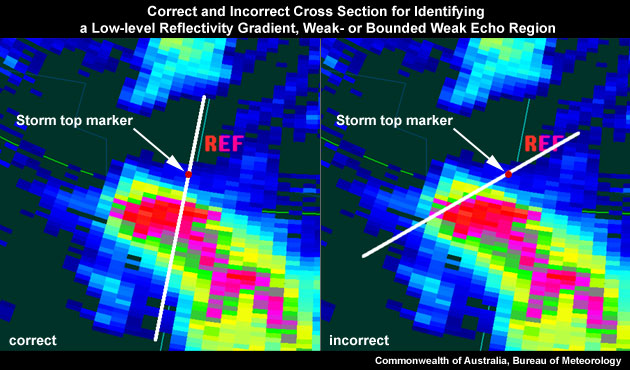
On the left is a correctly placed cross section for identifying a WER, as the most direct path from the low level reflectivity core to the location of the storm top marker. On the right is an example of an incorrectly placed cross section.
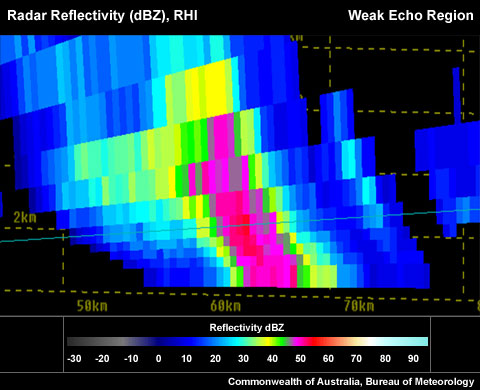
- Is there an area of weak echoes bounded by strong echoes above and on one side (see Figure 1)? If yes, a WER is present.
Potential Difficulties in Detection
- Low-topped storms – If low equilibrium level (this is often the tropopause) is present, the thunderstorm is low-topped and vertically compressing the WER signature making it difficult to detect. This may be a particularly serious issue far away from the radar.
- Radar sampling
- Radar not "aligned" well with the storm. The radial from the radar does not allow a direct line from the storm top to the low-level core. An arbitrary (non-radial) cross section should be used in such a case, which is an interpolated RHI with smoothed data.
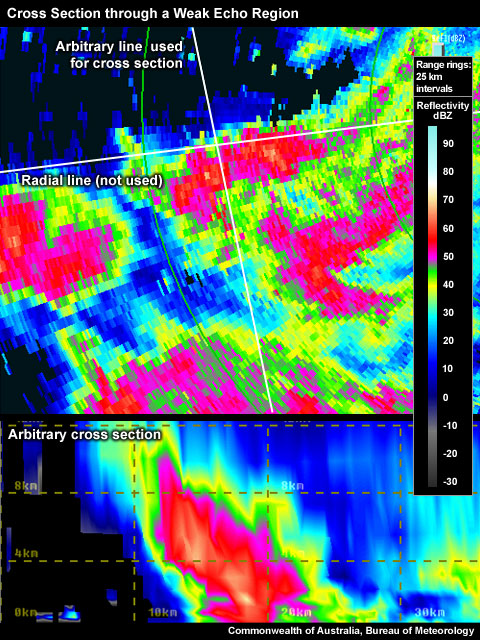
Arbitrary cross section through a WER that is sloping across a radial radar beam.
-
- The thunderstorm is too far away from the radar and the beam overshoots the signature.
- The thunderstorm is too close
Examples of Weak Echo Regions
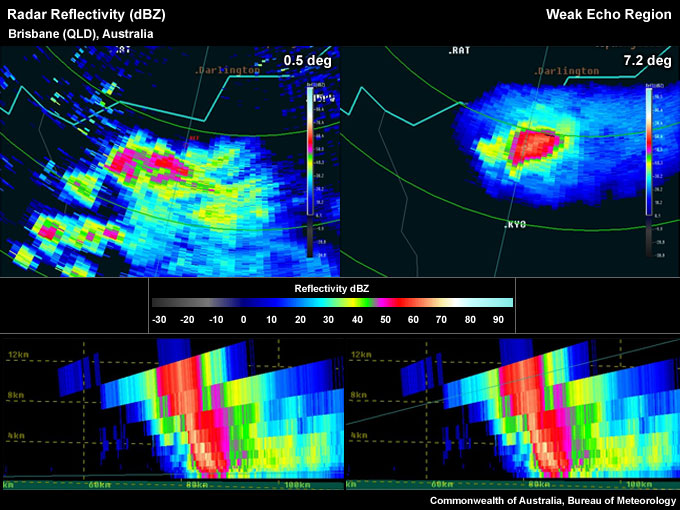
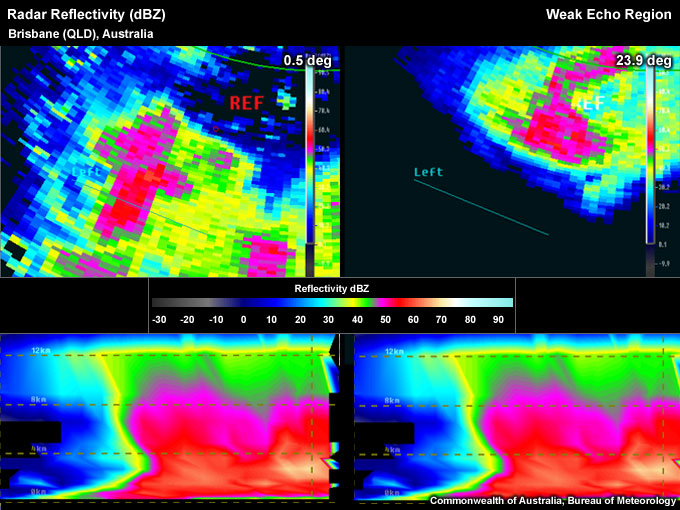
A WER is evident in the PPI when comparing a low-level scan with an upper-level scan. Notice the reference point centred on the upper level core, on the right, is well displaced from the low-level core, on the left.
A WER similar to Example 1, but with a larger overhang evident in the RHI display
A WER with a small overhang is seen in the RHI.
WER Look–a–Likes
- Fast moving storm – This look-a-like can give the impression of a WER. The thunderstorm moves so quickly towards or away from the radar that during the time the volume scan is built at each elevation, the storm has moved enough to give the impression of a horizontal core displacement with height. Notice the steplike appearance of the core through the depth of the storm.
Fast moving storm with a step-like appearance of the core of the storm, creating a false WER.
- Overhang is not on the updraft/inflow side – It is important to be sure the WER is located on the updraft/inflow flank of the thunderstorm. This should not be an issue if you use the detection method explained above. A WER is a signature suggesting storm severity based on the likely association of an echo overhang with a strong updraft. There could be many reasons for finding a false WER, including the other look-a-likes in this section.
Arbitrary cross section placed across a core that is well removed from the dominating updraft of this storm (storm top shown in the right panel).
- Elevated core from a separate updraft – More often than not storms are multicellular in nature with several updrafts located close to each other. Sometimes this can lead to confusion while interrogating storms, connecting elevated cores that are slightly displaced to a low level core and assuming it is a single core with a WER.
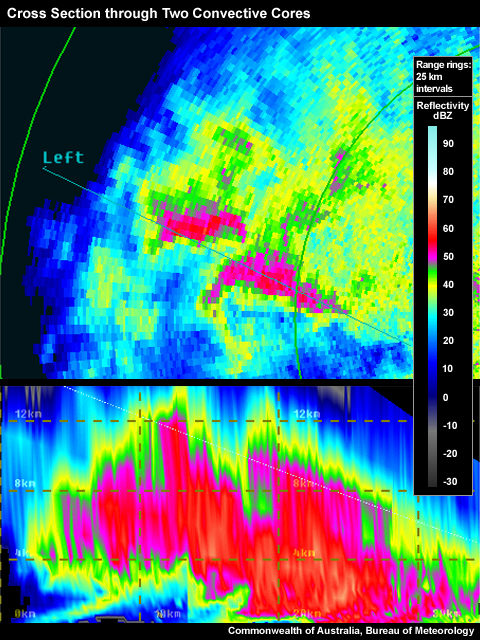
This cross section has been placed in such a way that it intersects at least two major updrafts, indicated by the substantial high-level (~9 km) cores in the PPI pane. The result looks like a single (complex) WER, but is actually the combined core of multiple updrafts.
- Overspreading anvil – This should rarely be confused with a WER, as anvils tend to have weaker reflectivities, than those typically found within potentially severe thunderstorm cores.
The RHI panel (lower panel) shows an anvil extending to the left of the main core of the storm. The weak echo area below the anvil is clearly not a WER.