Conceptual Model
A Weak Echo Region (WER) is used as one of many signatures that may indicate thunderstorm severity. The presence of a WER indicates that the thunderstorm possesses a strong updraft with diverging flow at the updraft summit. The hydrometeors within this divergent flow are forced outward into a thick anvil from where they descend into the approaching environmental winds. The descending precipitation, apparent on radar as a sloping echo overhang, is swept back toward the storm's updraft flank where later the hydrometeors eventually reach the surface. As the precipitation falls from the divergence signature aloft it is replaced with more precipitation diverging from the continuing updraft, producing a longer-lived signature. Hail growth is likely, providing the updraft extends past the freezing level into the -10°C to -30°C layer. In addition, a strong updraft can suspend large amounts of precipitation, especially hail, that can travel across and through the updraft without falling back through the updraft. The precipitation instead descends within the sloping echo overhang and the weaker portions of the updraft, creating a weak echo region below the overhang.
A strong updraft increases the chances of all four severe convective hazards to be produced. Large hail and damaging winds are most likely to occur and are both used as criteria to determine a severe thunderstorm in Australia. Damaging winds are included, as a strong updraft is likely to produce a strong downdraft, especially if large hail is expected.
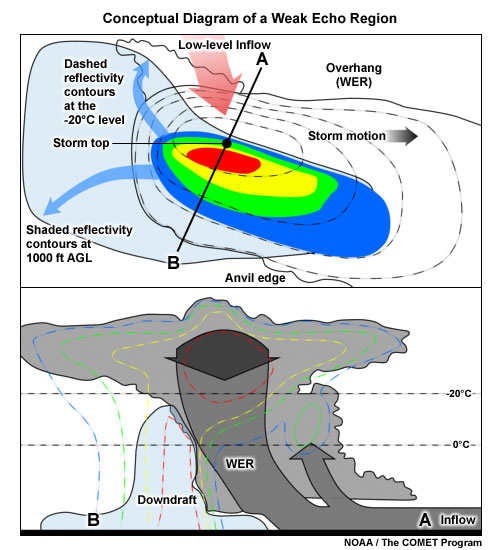
A conceptual model of the structure of a WER within a severe thunderstorm (northern hemisphere example). The top image shows a plan view of the storm low-level (shaded reflectivity contours) and the -20°C level (dashed reflectivity contours). The blue arrows represent the upper divergence. The red arrow represents the inflow. The lower image shows a cross section of the storm, with the reflectivity contours dashed. The grey arrows represent the updraft with the blue shaded region the downdraft.
Determining Thunderstorm Classification
WERs are mainly found in severe storms in sheared environments, especially in supercells. Occasionally small WERs can be found in more pulse-driven severe thunderstorms, especially if some amount of weak deep-layer shear is present, although these WERs tend to be short-lived. Multicell modes, both cluster and linear, can also produce WERs, as their composition can include strong individual cells.
To help determine the classification of the thunderstorm you are observing, use the following flow chart to help diagnose which thunderstorm conceptual model you should consider more closely.