
Detection
A mid-level mesocyclone is a storm-scale (2-10 km in diameter) vortex, usually cyclonic, in the mid-levels of a convective storm that satisfies the mesocyclone intensity and spatiotemporal extent criteria listed below. In this resource, "midlevels" is defined as the section of a deep convective storm that is approximately halfway between the base and the top of the thunderstorm. The mesocyclone also is required to be in the vicinity of or collocated with a deep convective updraft.
For the rotation to be classified as a mesocyclone, the vortex generally needs to possess the following characteristics that have been used as quantitative criteria by the US National Severe Storms Laboratory and National Weather Service:
- Duration – signture is evident on at least 2 successive 10 minute radar volume scans
- Horizontal Size – signature is 2-10 km in diameter
- Vertical Size– signature is at least 3 km in vertical depth
- Intensity– signature shows rotational velocity of at least 15 ms-1, or vertical vorticity on the order of 10-2 s-1 or higher
- Location– signature is located in the vicinity of a deep convective updraft
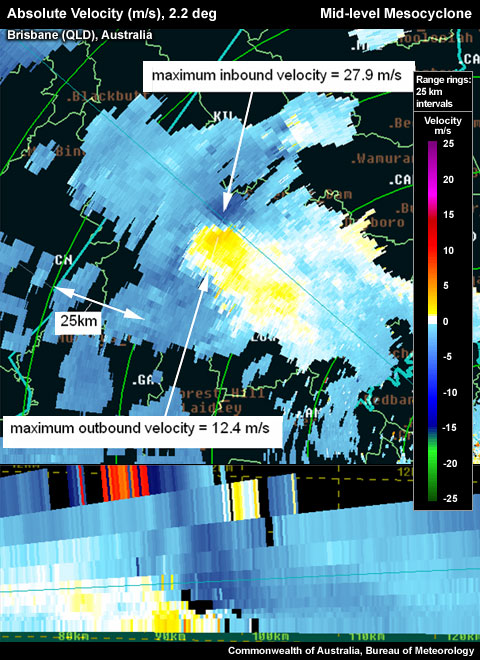
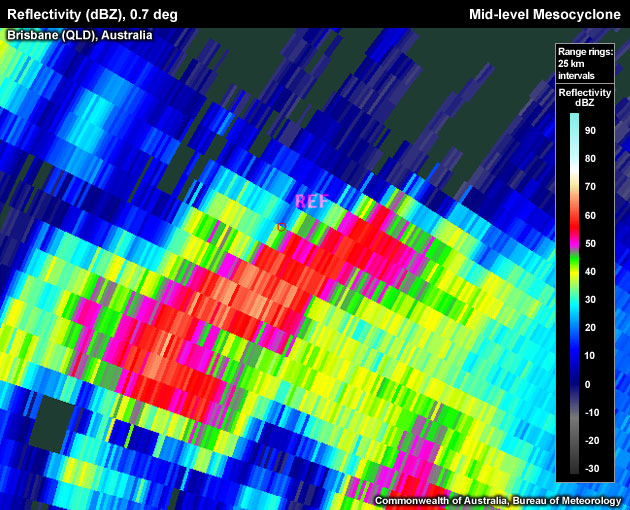
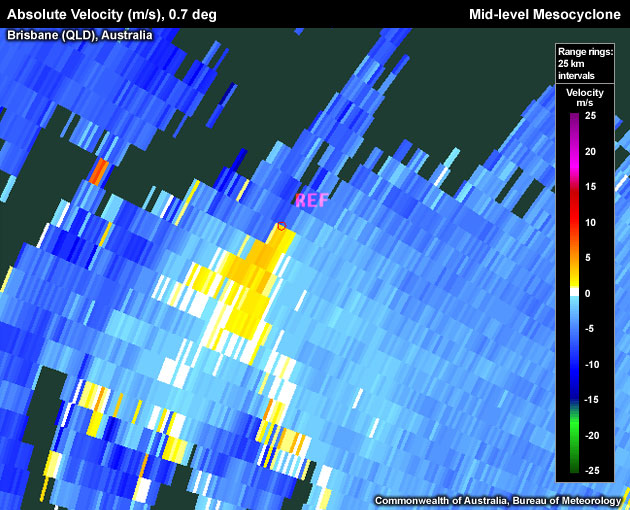
Clockwise mid–level mesocyclone with clear inbound/outbound couplet.
To detect a Mid-level Mesocyclone signature, use the following techniques:
Reflectivity: PPI/Plan View
Determining updraft location:
- Step up in elevation scans until you run out of >50 dBZ echoes.
- Step down one elevation scan.
- Centre cursor on the upshear side of the > 50 dBZ core. Note: This is to account for storm movement in strong winds aloft, which results in core movement between the lowest and storm top–level radar scans.
- Set a reference point.
- Step down to the midlevels of the thunderstorm. The reference point should be at the location where a mesocyclone would be expected. Now switch to velocity data
Velocity: PPI/Plan View
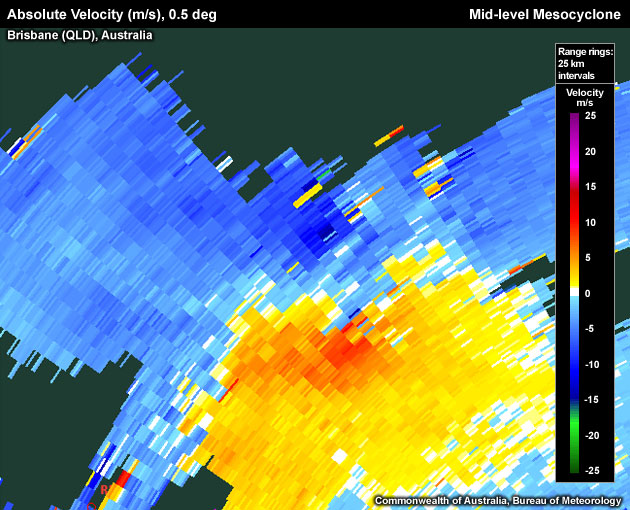
In the vicinity of the reference point, look for local maxima in the inbound and outbound radial velocities close to each other. Both velocity maxima should be at about the same range from the radar. Depending upon the component of the storm motion towards/away from the radar, the rotation may not be displayed as a symmetric inbound/outbound couplet, but may show a possibly highly asymmetric couplet. Even without any storm motion, or in a storm-relative frame of refrence, mesocyclones rarely manifest themselves as fully symmetric couplets. See the examples section for a demonstration of this couplet asymmetry.
Potential Difficulties in Detection
- Radar Sampling
- Aliasing–radial velocity values that exceed the radars Nyquist velocity, VN, are remapped to fictitious new radial velocities that fit within the interval ± VN. Once remapped, these velocities are considered "aliased" and their new appearance can easily mask the standard inbound/outbound velocity couplet of a mesocyclone, as shown in the example below.
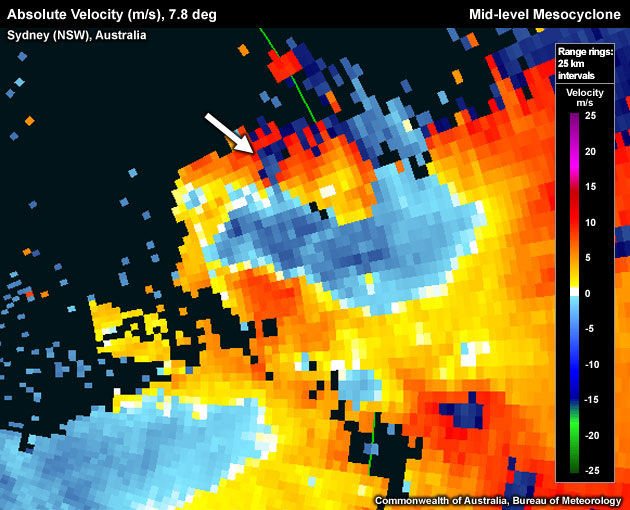
Cyclonic (clockwise in the southern hemisphere) mesocyclone with aliased outbound velocity – the aliased outbound pixels appear in dark blue instead of red or violet.
-
- Rapidly translating mesocyclones–when either the storm is moving fast or there is a strong background flow, a mesocyclone signature might be hard to recognise due to the often asymmetrical inbound/outbound couplet. In some cases the entire signature may be all outbound (inbound) when it moves rapidly away from (toward) the radar. The signature may be composed, for example, of very strongly outbound velocity next to less strongly outbound velocity.
- Poor velocity data– confidence in pixels, especially extreme values, are lowered. "Hot pixels" are possible due to unfolding algorithm failures for radars that run dual pulse repetition frequencies. A check for spatial and temporal continuity can identify most velocity data contaminations of this type.
- Beam Height– if a thunderstorm is far from (close to) the radar, it becomes increasingly likely that the radar beam will overshoot (undershoot) the midlevel mesocyclone.
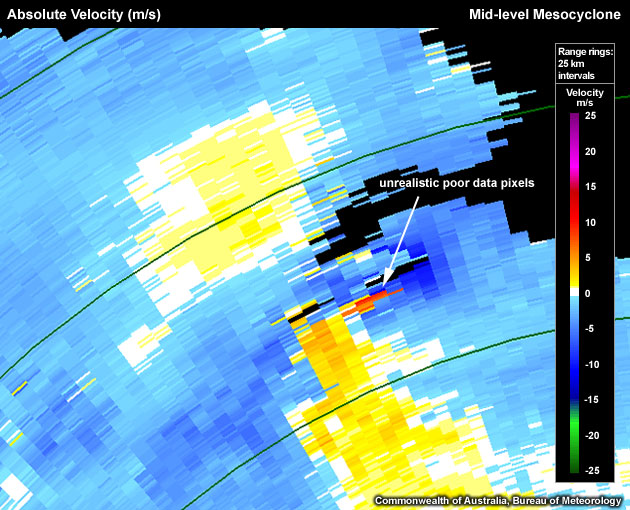
Cyclonic midlevel mesocyclone with unrealistic orange/red poor data pixels. Stepping up and down in elevation as well as forwards and backwards in time would reveal that these "hot pixels" suddenly appear and disappear, strongly indicating that their origin is unphysical.
- Resolution degradation as:
- Range increase– radar sampling degrades due to increasing beam width, which increasingly smoothes out any sharp velocity gradients in the mesocyclone
- Mesocyclone size decreases– radar sampling of the mesocyclone degrades for the same reason as above. "Mini-supercells" are particularly prone to this type of sampling problem.
- Timing of radar sampling– a mesocyclone could exist for nearly 20 minutes and only be captured on 1 scan, if 10 minute volume scans are used
Examples of Mid0level Mesocyclones
Use the radio buttons or click the image to switch between reflectivity and velocity imagery:
Very broad "hook", evident in the reflectivity, co-located with a broad low-level mesocyclone (oval) seen in the velocity field at the same elevation.
Use the radio buttons or click the image to switch between reflectivity and velocity imagery:
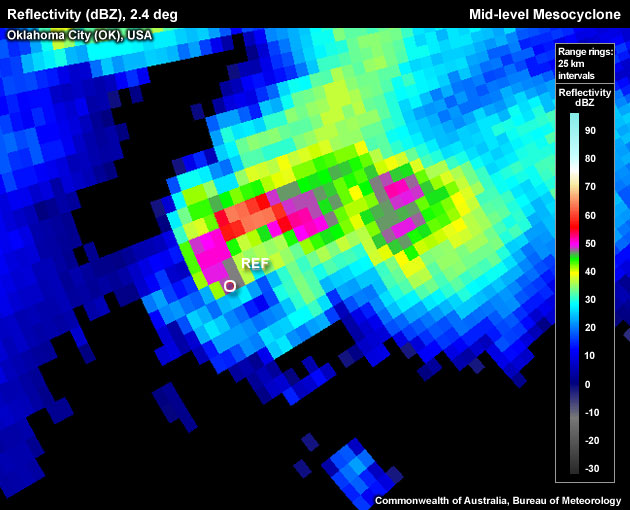

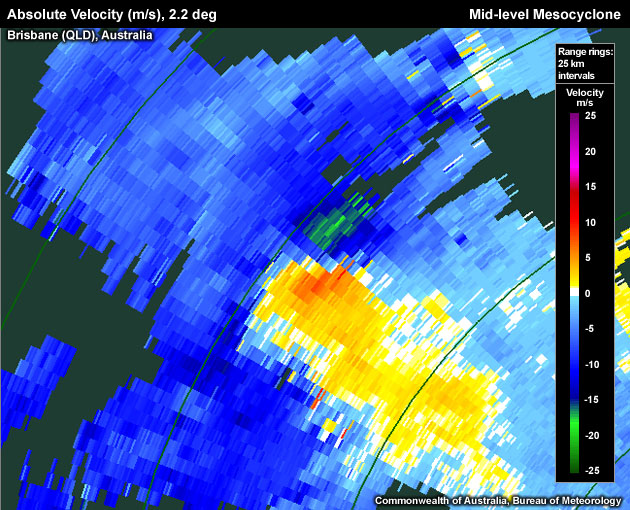
Northern hemisphere cyclonic (counter-clockwise) mid-level mesocyclone associated with a young supercell southwest of Oklahoma City on 3 May 1999. The mesocyclone is translating rapidly towards the radar, which leaves the inbound (southern) branch strongly aliased into the positive reds, while the outbound (northern) branch shows only very weak outbound base velocities. Note that the circulation centre is located at the tip of a deep hook echo on the storm's southwestern flank.
Use the radio buttons or click the image to switch between reflectivity and velocity imagery:
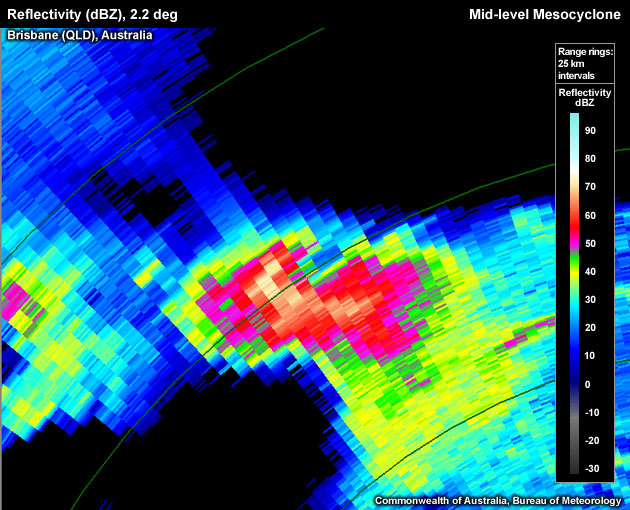
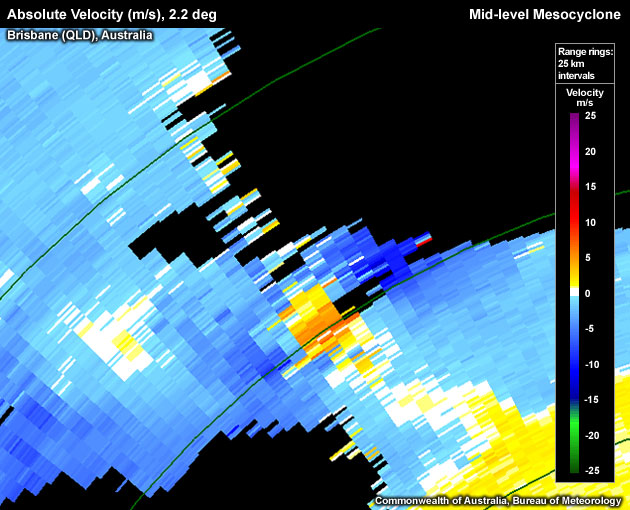
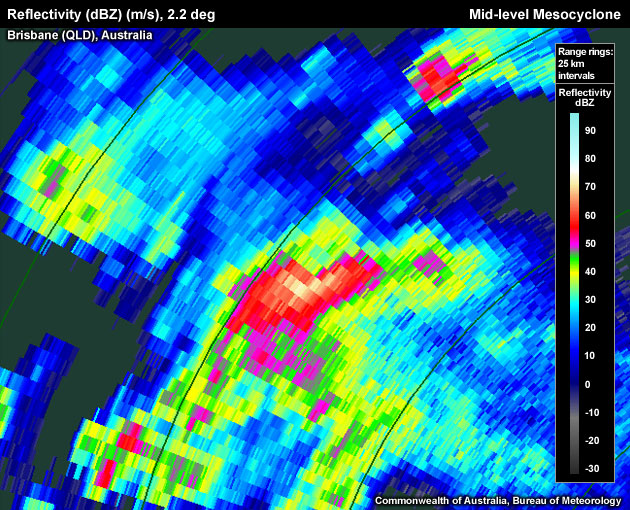
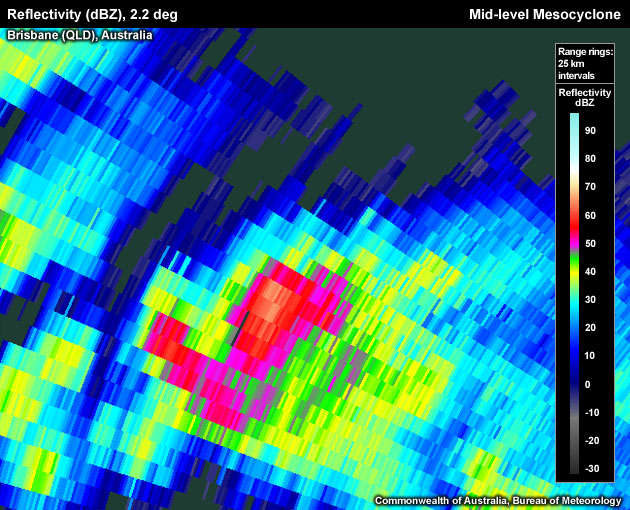
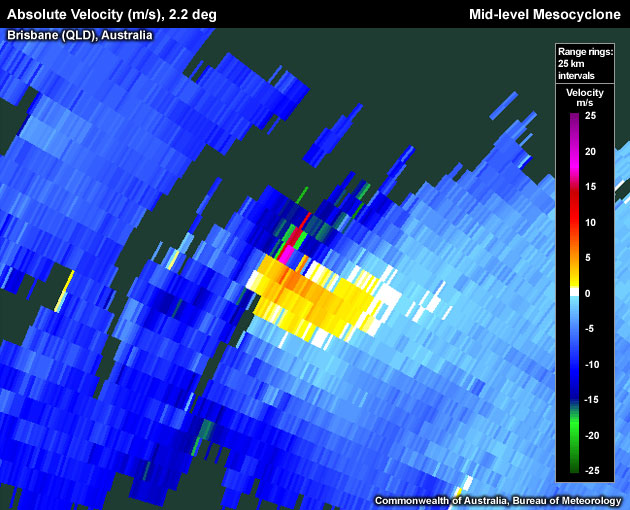
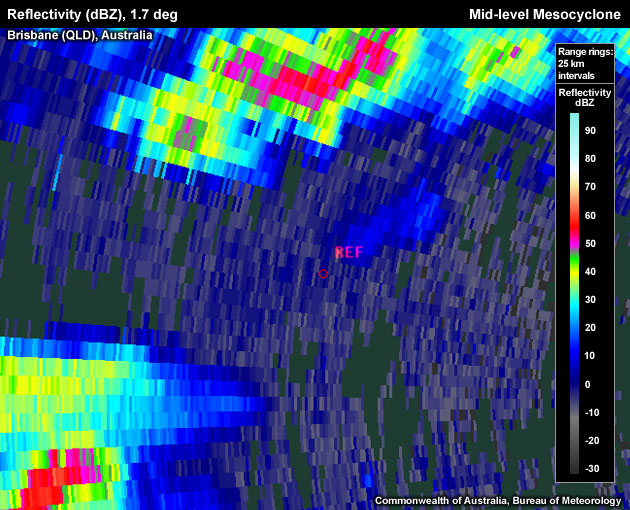
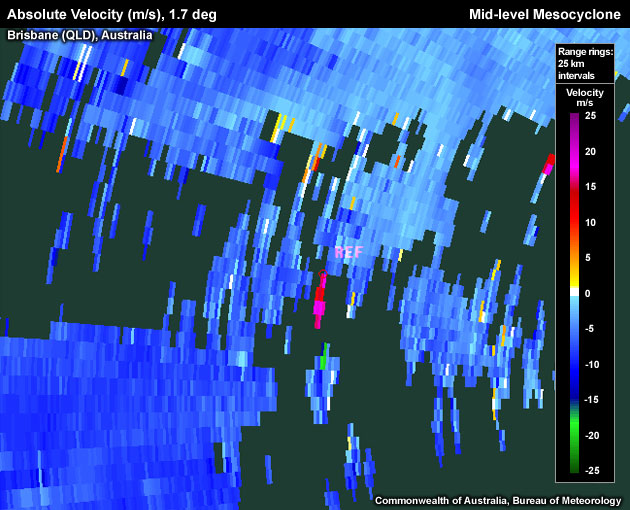
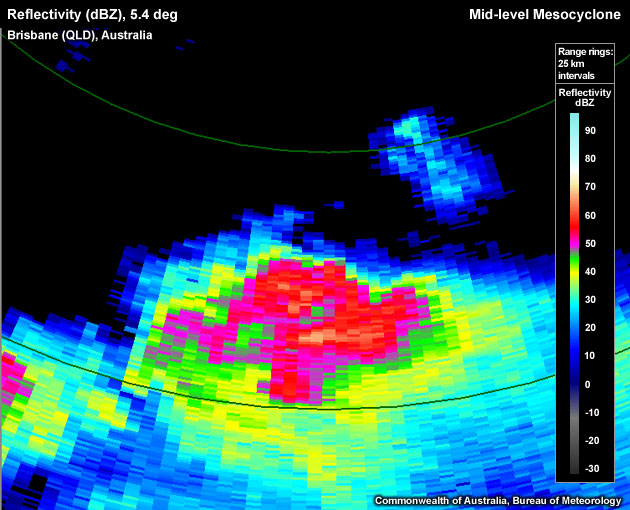
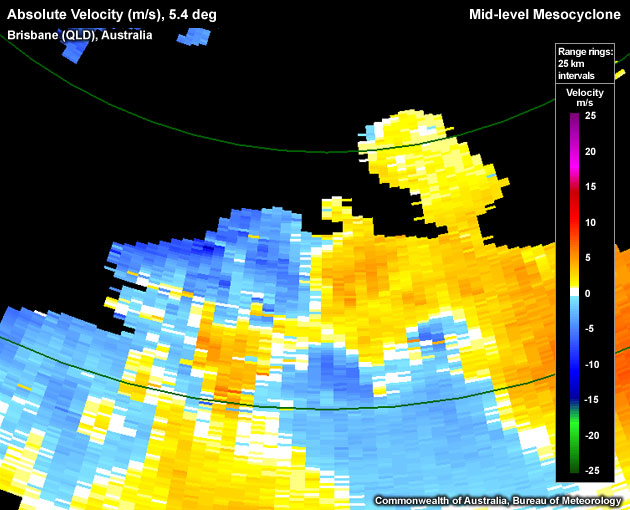
Cyclonic mid-level mesocyclone (southern hemisphere) collocated with a BWER on the northern flank of this supercell. Note the Three Body Scatter Spike (TBSS) in the reflectivity image. (Note: there is a slight discrepancy in the zoom level between these two images.)
Use the radio buttons or click the image to switch between reflectivity and velocity imagery:
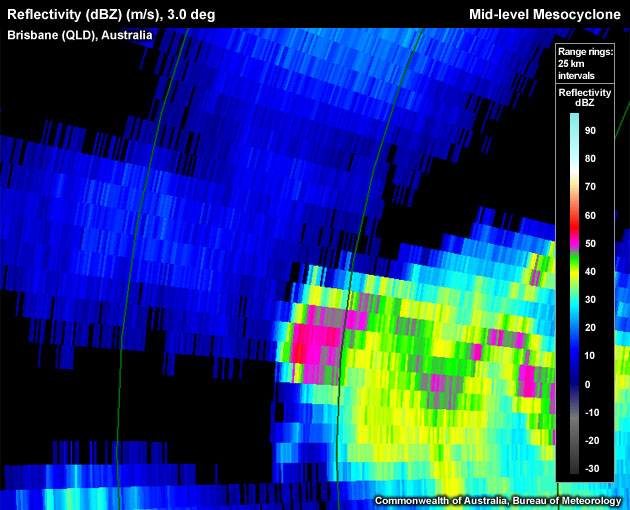
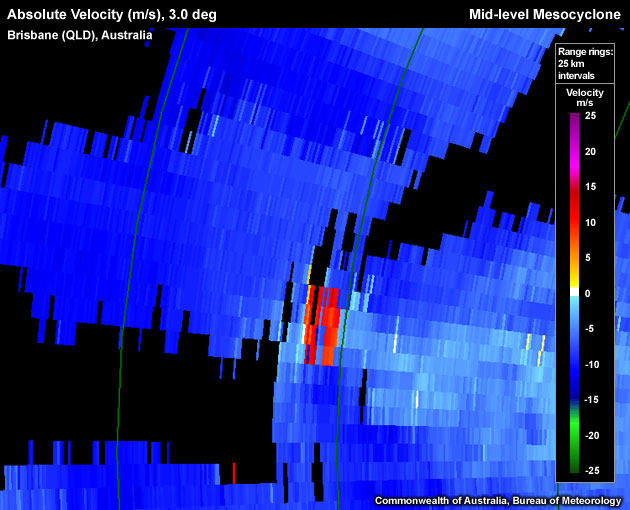
Cyclonic mid-level mesocyclone (SH) "hot" orange and red pixels; these pixels first give the impression of aliased or folded velocity data, but an inspection of surrounding scans in space and time suggest poor velocity data. The mid-level mesocyclone centre is located on the northern flank of the storm, rather than inside the weak echo region to the southwest, due to a new strong updraft at this location.
Mid-level Mesocyclone Look–a–likes
- Poor Velocity Data – most Australian Doppler radars scan using two pulse repetition frequencies (dual PRT) in order to increase their Nyquist velocity. Velocity data can therefore be affected by the performance of the unfolding algorithm, occasionally producing extreme values that are false. The example below shows light blue pixels moving straight into red values, which is too large an acceleration over a very short distance to be realistic. The reflectivity data also suggests a rather non-severe looking cell.
Use the radio buttons or click the image to switch between reflectivity and velocity imagery:
Corrupted velocity pixels that do not indicate rotation. Step forward/backwards as well as up/down in elevation angle to confirm that this feature has no temporal or spatial continuity.
- Weak shear – The rotational velocity is weaker than the thresholds for a minimal mesocyclone, and would be classified in the "weak shear" regime of the rotational velocity and radar range nomogram discussed in the Diagnosis section.
Use the radio buttons or click the image to switch between reflectivity and velocity imagery:
An intensifying storm shows a cyclonic circulation with outbound velocities of approximately 6 m/s and inbound velocities of approximately 13 m/s. These values are insufficient to classify the couplet as a mesocyclone.
- Divergence/Convergence – these can sometimes be confused with rotation. Note the white isodop between the divergence or convergence signature.
Clockwise midlevel circulation that contains a strongly convergent component.
- Signature not collocated with an updraft – A true mesocyclone must be identified as storm-scale rotation in close proximity to an updraft.
Use the radio buttons or click the image to switch between reflectivity and velocity imagery:
The velocity panel shows what could be mistaken for a small but intense clockwise circulation near the center of the image. The corresponding reflectivity panel confirms that the possible circulation is a radar artefact.
- Limited vertical extent ("single level vortex") – by definition, a vertical extent of approximately 3 km or more is required for a true mesocyclone.
- Circulation diameter is too large – a broad area of rotation exceeding the 2 – 10 km range is more likely the result of processes occurring on a scale larger than that of tilting of horizontal vortex lines by an updraft.
Use the radio buttons or click the image to switch between reflectivity and velocity imagery:
A broad area of cyclonic shear extending through the entire northern flank of a storm.
- Signature not persistent – A signature must be evident for at least 10 minutes to be classified as a mesocycone.